10-K: Annual report [Section 13 and 15(d), not S-K Item 405]
Published on February 19, 2026
UNITED STATES
SECURITIES AND EXCHANGE COMMISSION
Washington, D.C. 20549
FORM 10-K
For the fiscal year ended December 31 , 2025
OR
For the transition period from __________ to __________
Commission File Number: 001-39352
(Exact name of registrant as specified in its charter)
(State or other jurisdiction of incorporation or organization) | (I.R.S. Employer Identification Number) | |||||||
(Address of Principal Executive Office)
(770 ) 432-2744
(Registrant’s telephone number, including area code)
Securities registered pursuant to Section 12(b) of the Act:
Securities registered pursuant to Section 12(g) of the Act: None
Title of each class | Trading symbol(s) | Name of each exchange on which registered | ||||||
Indicate by check mark if the registrant is a well-known seasoned issuer, as defined in Rule 405 of the Securities Act. ☒ Yes ☐ No
Indicate by check mark if the registrant is not required to file reports pursuant to Section 13 or Section 15(d) of the Act. ☐ Yes ☒ No
Indicate by check mark whether the registrant (1) has filed all reports required to be filed by Section 13 or 15(d) of the Securities Exchange Act of 1934 during the preceding 12 months (or for such shorter period that the registrant was required to file such reports), and (2) has been subject to such filing requirements for the past 90 days. ☒ Yes ☐ No
Indicate by check mark whether the registrant has submitted electronically every Interactive Data File required to be submitted pursuant to Rule 405 of Regulation S-T (§232.405 of this chapter) during the preceding 12 months (or for such shorter period that the registrant was required to submit such files). ☒ Yes ☐ No
Indicate by check mark whether the registrant is a large accelerated filer, an accelerated filer, a non-accelerated filer, a smaller reporting company, or an emerging growth company. See the definitions of “large accelerated filer,” “accelerated filer,” “smaller reporting company,” and “emerging growth company” in Rule 12b-2 of the Exchange Act.
| ☒ | Accelerated Filer | ☐ | |||||||||
| Non-accelerated Filer | ☐ | Smaller Reporting Company | |||||||||
| Emerging Growth Company | |||||||||||
If an emerging growth company, indicate by check mark if the registrant has elected not to use the extended transition period for complying with any new or revised financial accounting standards provided pursuant to Section 13(a) of the Exchange Act). o
Indicate by check mark whether the registrant has filed a report on and attestation to its management’s assessment of the effectiveness of its internal control over financial reporting under Section 404(b) of the Sarbanes-Oxley Act (15 U.S.C. 7262(b)) by the registered public accounting firm that prepared or issued its audit report. ☒
If securities are registered pursuant to Section 12(b) of the Act, indicate by check mark whether the financial statements of the registrant included in the filing reflect the correction of an error to previously issued financial statements. o
Indicate by check mark whether any of those error corrections are restatements that required a recovery analysis of incentive-based compensation received by any of the registrant’s executive officers during the relevant recovery period pursuant to §240.10D-1(b). o
Indicate by check mark whether the registrant is a shell company (as defined in Rule 12b-2 of the Exchange Act). o Yes ☒ No
The aggregate market value of voting and non-voting common stock held by non-affiliates of the registrant (for this purpose, executive officers and directors of the registrant are considered affiliates) as of June 30, 2025 (the last business day of the most recently completed second quarter) was approximately $4.80 billion based on the closing sales price of the registrant's common stock on that date as reported on the New York Stock Exchange.
Number of shares of the registrant’s Class A common stock outstanding at February 12, 2026: 244,667,792 .
Number of shares of the registrant’s Class B common stock outstanding at February 12, 2026: 5,864,555 .
DOCUMENTS INCORPORATED BY REFERENCE
Certain information required by Part III of this Report, to the extent not set forth herein, is incorporated herein by reference from the registrant’s definitive proxy statement relating to the annual meeting of stockholders to be held in 2026. Except with respect to information specifically incorporated by reference in this Annual Report on Form 10-K, the registrant’s definitive proxy statement shall not be deemed to be filed as part hereof.
1
CAUTIONARY NOTE REGARDING FORWARD-LOOKING STATEMENTS
This Annual Report on Form 10-K contains forward-looking statements within the meaning of the “safe-harbor” provisions of the Private Securities Litigation Reform Act of 1995 that reflect future plans, estimates, beliefs, and expected performance. All statements contained in this Annual Report on Form 10-K other than statements of historical fact, including statements regarding our future operating results and financial position, our business strategy and plans, our objectives for future operations, macroeconomic trends, including the impact of tariffs and global trade relations, macro trends in the cancer care, nuclear power and small modular reactor industries and our competitive positioning are forward-looking statements. This includes, without limitation, statements under “Part II, Item 7. Management’s Discussion and Analysis of Financial Condition and Results of Operations” regarding our financial position, capitalization and capital structure, indebtedness, business strategy, and the plans and objectives of management for future operations, market share and products sales, future market opportunities, future manufacturing capabilities and facilities, future sales channels and strategies, goodwill impairment, backlog, our supply chain challenges, matters affecting Russia, relations between the United States and China, conflict in the Middle East, foreign exchange, tariffs or other trade disruptions, interest rate and inflation trends, any merger, acquisition, divestiture or investment activity, including integration of previously completed mergers and acquisitions, or other strategic transactions and investments, legal claims, litigation, arbitration or similar proceedings, including with respect to customer disputes, and the future or expected impact on us of any epidemic, pandemic or other crises. These statements constitute projections, forecasts, and forward-looking statements, and are not guarantees of performance. When used in this Annual Report on Form 10-K, words such as “anticipate,” “believe,” “continue,” “could,” “estimate,” “expect,” “intend,” “may,” “might,” “plan,” “possible,” “potential,” “predict,” “project,” “should,” “strive,” “seeks,” “plans,” “scheduled,” “would” and similar expressions may identify forward-looking statements, but the absence of these words does not mean that a statement is not forward-looking. When we discuss our strategies or plans we are making projections, forecasts, or forward-looking statements. Such statements are based on the beliefs of, as well as assumptions made by and information currently available to, our management.
The forward-looking statements contained in this Annual Report on Form 10-K are based on our current expectations and beliefs concerning future developments and their potential effects on us. There can be no assurance that future developments affecting us will be those that we have anticipated. These forward-looking statements involve a number of risks, uncertainties, (some of which are beyond our control) or other assumptions that may cause actual results or performance to be materially different from those expressed or implied by these forward-looking statements. These risks and uncertainties include, but are not limited to, the following risks, uncertainties, and other factors:
•geopolitical and trade conditions, including matters affecting Russia, the relationship between the United States and China, conflict in the Middle East, risks related to tariffs and global trade relations, export controls and other trade barriers and risks of slowing economic growth or economic recession in the United States and globally;
•developments in government spending budgets in the United States and other countries, including budget reductions, sequestration, implementation of spending limits or changes in budgetary priorities, delays in the government budget process, a U.S. government shutdown or the U.S. government’s failure to raise the debt ceiling;
•our ability to manage our supply chain or difficulties with third-party manufacturers;
•risks related to government contracts including our ability to mitigate risks associated with long-term fixed price contracts;
•our ability to predict our future operational results
•risks related to the public’s perception of nuclear radiation and nuclear technologies
•risks related to information technology disruptions or security issues, including cyberattacks and data or systems breaches
•risks related to the use of artificial intelligence and machine learning in our operations;
•our ability to manage our independent sales representatives, distributors, and original equipment manufacturers;
•our ability to realize the expected benefit from strategic transactions, such as acquisitions, divestitures and investments, including any synergies or internal restructuring and improvement efforts;
•our ability to issue debt, equity or equity-linked securities in the future;
•risks related to changes in tax law and ongoing tax audits;
•our ability to attract, train, and retain key members of our leadership team and other qualified personnel;
•risks related to the costs or liabilities associated with product liability claims;
•risks related to the adequacy of our insurance coverage;
•risks related to the global scope of our operations, including operations in international and emerging markets;
•risks related to our exposure to fluctuations in foreign currency exchange rates, interest rates, tariffs, reciprocal and retaliatory tariffs and other tariff-related measures, and inflation, including the impact on our debt service costs;
•our ability to comply with various laws and regulations and the costs associated with legal compliance;
•risks related to the uncertainty and outcome of any legal claims, litigation, arbitration, government and regulatory proceedings, investigations and inquiries;
•risks related to our ability to protect or enforce our proprietary rights on which our business depends or third-party intellectual property infringement claims;
•liabilities associated with environmental, health, and safety matters; and
•other risks and uncertainties indicated in this Annual Report on Form 10-K, including those under the heading “Risk Factors,” and other documents filed or to be filed with the SEC by us.
There can be no assurance that future developments affecting us will be those that we have anticipated. These forward-looking statements involve a number of risks, uncertainties (some of which are beyond our control) or other assumptions that may cause actual results or performance to be materially different from those expressed or implied by these forward-looking statements. Should one or more of these risks or uncertainties materialize, or should any of our assumptions prove incorrect, actual results may vary in material respects from those projected in these forward-looking statements.
Forward-looking statements included in this Annual Report on Form 10-K speak only as of the date of this Annual Report on Form 10-K or any earlier date specified for such statements. We undertake no obligation to update or revise any forward-looking statements, whether as a result of new information, future events, or otherwise, except as may be required under applicable securities laws.
We intend to announce material information to the public through the Mirion Investor Relations website, available at ir.mirion.com, SEC filings, press releases, public conference calls, and public webcasts. We use these channels, as well as
2
social media, to communicate with our investors, customers, and the public about our company, our offerings, and other issues. It is possible that the information we post on our website or social media could be deemed to be material information. As such, we encourage investors, the media, and others to follow the channels listed above, including the social media channels listed on our investor relations website, and to review the information disclosed through such channels. Any updates to the list of disclosure channels through which we will announce information will be posted on the investor relations website.
3
TABLE OF CONTENTS
| Page | |||||
4
5
CERTAIN DEFINED TERMS
Unless the context otherwise requires, all references in this Annual Report on Form 10-K to “Mirion,” the “Company,” “we,” “us” or “our” refer to Mirion Technologies, Inc.
Unless otherwise stated in this Annual Report on Form 10-K or the context otherwise requires, references to:
“ASC” are to the Accounting Standards Codification;
“Board” and “Board of Directors” are to the board of directors of Mirion Technologies, Inc.
“Bylaws” are to the bylaws of Mirion Technologies, Inc. in effect as of the date of this Annual Report on Form 10-K;
“Charter” are to the certificate of incorporation of Mirion Technologies, Inc. in effect as of the date of this Annual Report on Form 10-K;
“Class A common stock” are to shares of Mirion’s common stock, par value $0.0001 per share;
“Class B common stock” are to shares of Mirion’s common stock, par value $0.0001 per share;
“Closing Date” are to GS Acquisition Holdings Corp II or “GSAH” renamed to Mirion Technologies.
“Common stock” are to the Class A common stock and Class B common stock;
“DGCL” are to the General Corporation Law of the State of Delaware;
“Exchange Act” are to the Securities Exchange Act of 1934, as amended;
“Founder shares” are to the Founder Shares (as defined under Note 15, Related Party Transactions, in the notes to the financial statements included in this Annual Report on Form 10-K);
“IntermediateCo” are to Mirion IntermediateCo, Inc., a Delaware corporation direct subsidiary of Mirion;
“IntermediateCo Class A common stock” are to the shares of Class A common stock of IntermediateCo, par value $0.0001 per share;
“IntermediateCo Class B common stock” are to the shares of Class B common stock of IntermediateCo, par value $0.0001 per share;
“Private placement warrants” are to the Private Placement Warrants (as defined under Note 15, Related-Party Transactions in the notes to the financial statements included in this Annual Report on Form 10-K);
“Public warrants” are to the Public Warrants (as defined under Note 15, Related-Party Transactions, in the notes to the financial statements included in this Annual Report on Form 10-K);
“Sarbanes-Oxley Act” are to the Sarbanes-Oxley Act of 2002;
“Securities Act” are to the Securities Act of 1933, as amended;
“Sponsor” are to GS Sponsor II LLC, a Delaware limited liability company;
“Sponsor Agreement” are to the Second Amended and Restated Sponsor Agreement, dated as of October 20, 2021, by and among us, the Sponsor and the other parties thereto; and
“Warrants” are to the public warrants and private placement warrants.
6
PART I
ITEM 1. BUSINESS
Business Overview
At Mirion, we deliver vital protection that unlocks the transformative potential of radiation to move science, industry and medicine forward. For more than 60 years Mirion and our predecessor companies have provided products, services, and software that allow customers to safely leverage the power of ionizing radiation for applications that benefit the health, safety, vitality, and technological progress of the human experience. As a global leader in the field of radiation safety and innovation, we bring together unrivaled expertise with an unmatched range of reliably precise technologies.
Safety is at the core of what we do. Through critical nuclear facilities, R&D labs, cancer centers, diagnostic imaging facilities, and on the front lines, Mirion empowers innovations that move radiation safety, measurement and medicine further to shape our future world. Many of our markets are characterized by the need to meet rigorous regulatory standards, design qualifications, and operating requirements. Throughout our history, we have successfully leveraged the strength of our expertise to continually drive innovation and expand the commercial applications of our core technology competencies.
Headquartered in Atlanta, Georgia, we have operations in Canada, the United Kingdom, France, Germany, Finland, China, Belgium, Netherlands, Estonia, Japan, and South Korea.
Mirion is comprised of two reporting segments: Nuclear & Safety (formerly named Technologies) and Medical. Our Nuclear & Safety segment powers advancements in nuclear energy and critical radiation safety, measurement and analysis applications across nuclear power facilities, laboratories, research and other industrial markets such as defense. Our Medical segment improves the quality and safety of cancer care delivery and supports applications across medical diagnostics and practitioner safety.
Our products, software and services are sold directly and indirectly to a variety of end-use customers. Customers span active nuclear power reactors,innovators in Small Modular Reactor (SMR) design, universities, numerous international government and supranational agencies, 23 of the 32 NATO militaries, national laboratories, environmental laboratories, research institutes, industrial companies, radiopharmaceutical drug manufacturers, hospitals, cancer centers, and small office healthcare providers. Mirion Medical has a presence in more than 80% of cancer centers worldwide and Mirion Nuclear & Safety solutions are in more than 98% of nuclear power plants globally.
Our broad product and services portfolio is supported by our engineering and research and development organization of 534 scientists, engineers, and technicians, who represented approximately 16% of our workforce as of December 31, 2025. We possess numerous product qualifications, trade secrets, and patents that support our market position and our ability to deliver next generation products and services.
Industry Overview
Nuclear & Safety
The Nuclear & Safety end market spans the entire nuclear fuel cycle, including mining, enrichment, fuel manufacturing, nuclear power generation, waste management and fuel reprocessing. Key nuclear installations include nuclear power plant (“NPPs”) and fuel mining and fabrication facilities. We sell products and services for use in each of these types of installations at all stages of their life cycle (construction, operation, decommissioning and dismantling), with NPPs representing the majority of our sales into the nuclear end market and the global NPP installed base, with new opportunities forming from innovations like SMRs. This market is segmented between new builds, installed base requesting upgrades/uprates/re-licensing, and decommissioning and dismantling.
The overall market conditions for nuclear power continue to be positive. The International Atomic Energy Agency (IAEA) raised its annual nuclear projections, for the fifth year in a row, as countries turn to nuclear for energy security and climate action. United Nations ("UN") countries continue to support a declaration to triple nuclear energy capacity by 2050, recognizing the key role of nuclear energy in reaching climate control objectives. At the UN COP30 conference, additional support from financial institutions was declared, reinforcing the investment community's commitment to nuclear energy. Also, we expect increased demand for nuclear due to the escalated energy needs created by cloud computing and artificial intelligence data centers. For example, during 2024 and 2025, recommissioning of previously dormant NPPs (Palisades, Three Mile Island, Duane Arnold) were announced in support of the rising energy demand, and we continue to see rapid developments across the Advanced Nuclear sector.
7
Our legacy in the nuclear industry positions us to capitalize on the growth in demand for radiation detection, measurement, analysis and monitoring products and services in each phase of the nuclear life cycle, as outlined in the chart below.
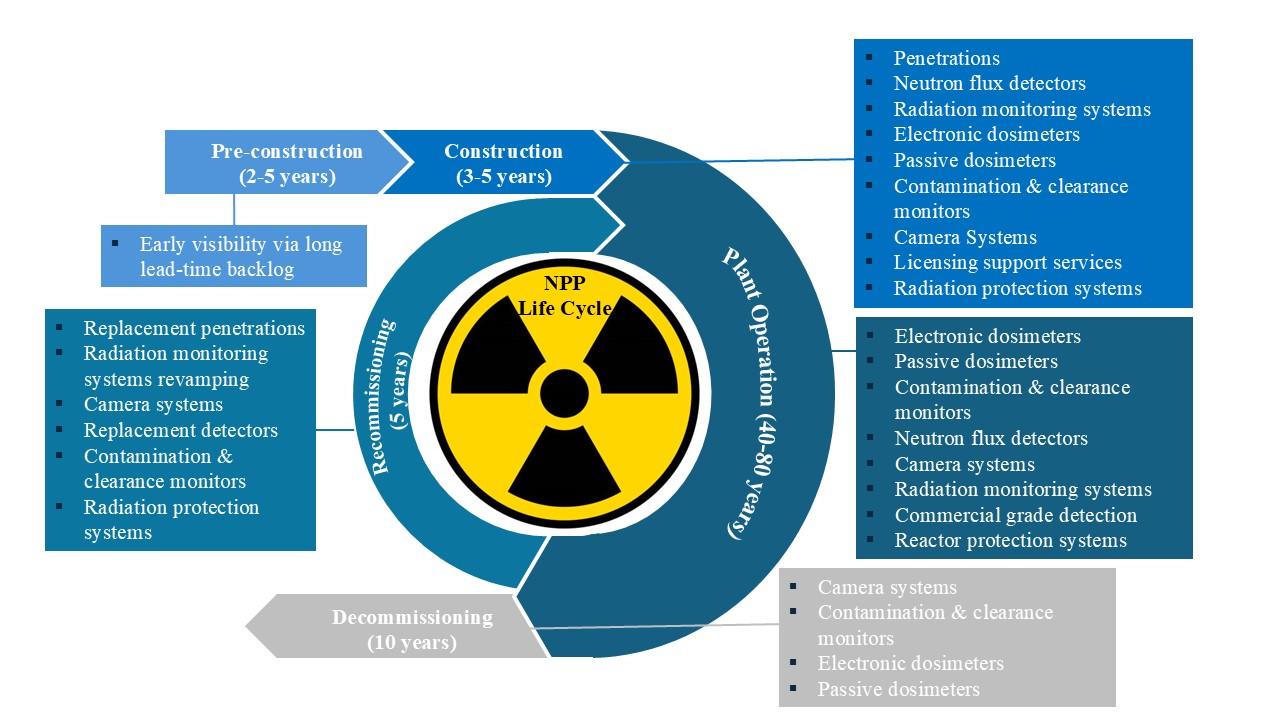
Factors representing opportunities for growth include (i) upgrade, replacement and retirement cycles of our radiation detection, measurement, analysis and monitoring products, (ii) aging installed base of existing global installed nuclear reactors requiring frequent product replacements and upgrades (on average, the U.S. installed base is more than 40 years old and the global installed base is more than 30 years old), (iii) decontamination and decommissioning activity, (iv) large installed base of “orphaned” products and systems requiring operators of many aging NPPs to consider new suppliers to meet their detection needs, and (v) new build opportunity all represent opportunities for growth.
Other markets in Nuclear & Safety include laboratory and research, including different types of facilities such as environmental radiochemistry laboratories, research laboratories, research reactors and education laboratories; industrial facilities such as cement kilns, pulp and paper mills and coal/gas fired power boilers that utilize high-temperature industrial processes; and the defense end market serving military, civil defense and event-driven security spending for prevention and detection of radiological threats. In 2025 Mirion signed a first of a kind partnership agreement and practical arrangements with the International Atomic Energy Agency (IAEA), the world’s central intergovernmental forum for scientific and technical cooperation in the nuclear field, to cooperate in the area of radiation detection and measurement. Through this collaboration, Mirion’s advanced instrumentation and profound understanding of ionizing radiation combine with the IAEA’s expertise and influence to advance the safe and secure use of nuclear technology worldwide.
Medical
Our medical market is comprised of rapidly growing product applications for the safe diagnosis and treatment of cancer and occupational dosimetry services. We provide hardware, software and value added services within diagnostic imaging, radiation therapy, nuclear medicine and radiopharmaceutical therapy that enhance the effectiveness and safety of life-saving procedures. As the global population ages and the incidence of cancer continues to rise, advancing new treatments such as radioligand therapy, and ensuring safety is more important than ever. With our deep expertise in radiation measurement and safety, we partner with hospitals and cancer centers to advance safety and enhance the delivery of cancer care.
8
As diagnostic and radiotherapeutic procedures increase, so does the associated market opportunity for Mirion products, services and software that are deployed in hospitals, clinics, and other diagnostic and treatment centers around the world. We believe the global nuclear medicine market is expected to grow primarily driven by the increase in the prevalence and incidences of cancer worldwide. Likewise, the global radiation therapy market is expected to grow primarily driven by factors including growing awareness about the benefits of radiation therapy for cancer control and eradication, increasing incidence and prevalence of cancer, and technological advancements in the field of radiation therapy.
Mirion occupational dosimetry services span beyond cancer care to protect all healthcare workers exposed to radiation. Today, we badge over one million wearers, protecting lives of critical medical staff globally. We see a rise in government agencies outsourcing dosimetry services to private providers due to favorable cost dynamics in some regions. This trend provides a market opportunity to leverage our technical expertise and expand our North American service experience to other regions as we have done through our acquisitions of state-owned dosimetry services businesses in the Netherlands and Germany. We believe our core dosimetry market is expected to grow primarily driven by volume increase in number of healthcare workers exposed to radiation and standard annual price increases. Additionally, with differentiated technology now available in Mirion’s InstadoseVUE product line, we believe that we have the right product ecosystem to maximize opportunities across the occupational dosimetry landscape within medical and industrial industries.
Our Products
Nuclear & Safety
Nuclear Power: Our radiation monitoring systems enable the safe utilization of nuclear energy in nuclear power plants, nuclear research reactors, fuel cycle facilities, nuclear marine propulsion, and other specialized industries.
We provide essential products and services to NPPs and advanced reactor developers throughout the entire life cycle of a plant: from construction and operation to decommissioning and decontamination. With the addition of Certrec, Mirion solutions begin at plant Licensing, progress through on-going Regulatory needs and continue through proven solutions to obsolescence and parts availability challenges provided by Paragon Energy Solutions. Specifically, we provide (i) radiation protection, measurement and monitoring solutions that are typically installed during construction and replaced or upgraded during the lifetime of the reactors, (ii) reactor instrumentation and control detectors installed during construction that are replaced or upgraded regularly, (iii) measurement and expertise services to help customers address nuclear measurement needs, (iv) imaging systems and cameras for all stages of the nuclear lifecycle, and (v) waste management systems that are used during the lifetime of the reactors.
Labs & Research: Our high-precision instruments and software help research labs in the public and private sectors advance knowledge and understanding of radioactivity, from detection and analysis of samples, identification of radionuclides, and quantification of activity to empower the next wave of breakthrough innovation. Solutions involve radiation measurement and personal safety applications for private and government energy laboratories, research organizations and production counting labs (private and government radiochemistry labs for employee health & safety and government labs for regulatory monitoring). Product portfolios include but are not limited to our laboratory and scientific analysis systems (gamma/alpha spectroscopy, alpha/beta counting, specialty detectors, spectroscopy software), radiation measurement and health physics instrumentation.
Defense & Diversifieds: Our technologies safeguard nuclear materials to protect people and the environment through various radiation measurement applications tailored to non-nuclear industrial sites such as oil & gas, mining and quarrying for the monitoring and protection of personnel safety. We empower military and civil defense teams to precisely and discreetly detect and monitor radiation in the most critical and challenging situations from the front lines of modern battle, to securing cities and large-scale events, to nuclear event recovery operations, empowering them to keep populations safe. These solutions include Military CBRNE, or Chemical, Biological, Radiological, Nuclear and high-yield Explosives, security and search.
Medical
Cancer Care: Our solutions in the cancer care market bring a legacy of quality and safety to the healthcare space. Our suite of patient, machine, and diagnostic Quality Assurance (QA) solutions are relied on across the field of radiation oncology to mitigate errors, reduce inefficiencies, validate technologies/techniques and improve the quality of clinical cancer care. We are also an industry leader in Nuclear Medicine, providing solutions for radiopharmaceutical production, patient dosing and safe handling throughout the process.
9
Our comprehensive, independent Radiation Therapy solutions and services enhance the checks and balances that keep cancer treatment safe, effective and ever-improving. Specific solutions include linear accelerator (linac) commissioning, beam scanning, annual QA and phantoms for quality assurance. We are the global leader in Radiation Therapy QA hardware and have revolutionized quality management workflow with the SunCHECK(TM) Platform and continue advancements with the addition of Oncospace, providing cloud-based, AI-powered solutions for the radiation oncology community.
From dose preparation to patient administration, our Nuclear Medicine solutions and supplies enhance safety and accuracy to aid potentially life-saving imaging and therapy. Our high-quality hot lab solutions help equip work spaces for safety, protecting staff while meeting regulation and maintaining efficiency. Solutions across this space include dose calibrators, thyroid uptake systems, ultrasound tables, solutions for radiopharmaceutical therapy, C-Arm tables and the advanced workflows provided by ec2 Software.
Dosimetry Services: Radiation dosimetry in the fields of health physics and radiation protection is the measurement, calculation and assessment of the ionizing radiation dose absorbed by an object, usually the human body. Our dosimetry products and services remove the worry of radiation from the daily routines of those who are occupationally exposed. The Dosimetry Services business offers environmental radiation monitoring services, as well as an official dose of record to employers and occupationally exposed radiation workers, enhancing the effectiveness and efficiency of radiation safety programs at practitioner sites. Key product lines include the innovative Instadose dosimetry platform, optically stimulated luminescence, or OSL, dosimeters, and our range of eye, finger, and extremity dosimeters that integrate with our Dose Central data platform.
Our Competitive Strengths
We believe that the following competitive strengths will enable us to maintain our position and capitalize on growth opportunities in our end markets:
Large installed base driving recurring revenue. Our products are installed at the vast majority of the addressable, active nuclear power reactors globally (on average, the U.S. installed base is more than 40 years old and the global installed base is more than 30 years old). This installed base drives recurring revenue through replacement and service cycles associated with our offerings and the typical 40 to 100 year operating life cycle of an NPP. The length and quality of supplier relationships are important customer buying criteria due to high switching costs and the importance of proven product reliability. Additionally, according to the World Nuclear Association, as of January 2026 there are approximately 440 NPPs operating across 31 countries (plus Taiwan) worldwide, with 70 currently being constructed and 115 additional planned and expected to be in operation within the next 15 years. This drives recurring revenue and opportunities for cross sales from our other activities as over 80% of our Nuclear power end-market revenue comes from our installed base. In addition, we maintain relationships with global military and government organizations that value operating longevity and technological expertise. For example, our products have been sold to 23 of 32 NATO militaries as well as the U.S. Departments of Energy, State, Defense and Homeland Security. Our customers’ focus on personnel protection drives their recurring expenditures on service, recalibration and product upgrades in our defense end market. In the laboratories and research markets, we have developed relationships with certain customers over the past 50 years, gaining their loyalty based on product performance and customer services. Such relationships provide us with recurring revenues when our customers upgrade and replace their existing installed base. This same trend is found in Medical in which our QA solutions are used by approximately 80% of global cancer centers, driving recurring revenue and opportunities for cross-selling across the Medical business.
Trusted provider across highly-regulated fields.. Our end markets, including the nuclear power, medical and defense industries, are highly regulated and require compliance with strict product specifications. Our track record enables us to gain market share across our product and service offerings. We and our predecessor companies have served the radiation detection measurement, analysis and monitoring needs of our customers for over 60 years, having developed trusted, recognized brands supported by our tradition of technical excellence, product reliability and customer service. In addition, we have leveraged our historical ionizing detection expertise to develop new applications for our core markets and to expand into adjacent markets through acquisitions.
Broad and complementary product and service portfolio. Our comprehensive product line supports virtually all radiation detection and monitoring needs throughout the medical and industrial markets. We further enhanced our nuclear power market offerings with the acquisitions of Certrec and Paragon Energy Solutions. As a result, we believe that we have consistently gained wallet share as some of our key customers rationalize their supply chain. Furthermore, our portfolio provides Mirion with a natural opportunity to cross-sell our products and services to customers in various end markets. As a result, we have a diversified portfolio across end markets and geographies.
10
Technical complexity creates high barriers to entry. Across our end markets, we design our products to meet demanding customer specifications, qualifications and regulatory requirements. In many circumstances, our products are deployed in highly complex facilities and are required to operate effectively in harsh environments. Replicating our products is difficult given underlying technical specifications. In addition, customers generally work with incumbent suppliers to service, maintain and replace equipment over the product lifetime resulting in a natural barrier to entry.
Global footprint designed to meet local customer needs. Our global footprint, augmented by our established network of suppliers and distributors, enables us to be responsive to our customers and provide locally customized solutions. We operate facilities in 12 countries, accommodating the desire of certain customers to procure products and services from local providers. Sales to customers inside the United States and Canada accounted for approximately 48% of total revenue for fiscal 2025, with an additional 33% and 17% of total revenue accounted for by sales to customers in Europe and Asia Pacific respectively. We believe that our established global infrastructure provides a scalable platform to meet the growing worldwide demand for our products and services.
Proven M&A strategy and track record of integrating acquisitions. We have been built through successive mergers and acquisitions. Since 2016, we have acquired and integrated eighteen companies. Through these acquisitions, we have developed tools and experience across deal sourcing, modeling and integrating acquired companies. We have a business ecosystem in place to identify and act upon cost saving opportunities as well as the ability to leverage our scale platform to capture cross-selling opportunities.
In July 2025, we acquired Certrec Corporation. Headquartered in Fort Worth, TX, Certrec is a leader in regulatory compliance and advanced digital applications for the nuclear industry. The Certrec team and portfolio of solutions were integrated into the Company’s Nuclear & Safety segment and complement the Company’s existing nuclear power product suite while creating additional opportunities in the broader energy power markets.
On December 1, 2025, we acquired WCI-Gigawatt Intermediate Holdco, LLC, the indirect parent of Paragon Energy Solutions, LLC (“Paragon”). The Paragon acquisition provides Mirion’s nuclear power customers with a more comprehensive suite of product offerings and services to meet their growing needs and is reported as part of our Nuclear & Safety segment. Additionally, the acquisition of Paragon significantly enhances our presence in the U.S. nuclear power market. We believe Paragon will enhance Mirion's role as a leading global supplier to the nuclear power sector.
Seasoned management team complemented by highly skilled engineers. We are led by an experienced management team with a mix of private sector and government experience across different industries and functions. Our senior management team is complemented by an engineering and research and development organization of 534 scientists, engineers and technicians as of December 31, 2025, including the addition of approximately 150 highly skilled Paragon engineering and technician talent. A number of our employees are participants in international and U.S. standards setting organizations related to radiation detection in the nuclear power, defense and medical end markets. Through these activities, we help define the setting of standards and preview changes that impact our products, customers and end markets.
Our Strategy
Our objective is to continue enhancing our position as a global provider of radiation detection, measurement, analysis and monitoring products and services for the global nuclear power and medical end markets. We intend to achieve this through the following strategies:
Exploit under-penetrated market opportunities. We believe that we can exploit historically under-penetrated segments of our end markets by leveraging our existing positions across our major product categories. For example, we have leveraged our technical expertise to develop and commercialize innovative products to increase sales in the U.S. dosimetry services market and in the radiation therapy quality assurance market, and we have expanded our radiation monitoring solutions offering by leading integrated offers with other key suppliers for some nuclear new build projects in Europe to increase our scope of supply and gain share in the nuclear market.
11
Expand addressable market. We believe that substantial opportunities exist for us to expand our addressable market by marketing our products and services to customers in new geographic regions; providing products and services to customers moving to an outsource model; entering markets where the government is privatizing services; introducing new applications for existing technologies and pursuing strategic acquisitions.
•Geographic expansion. Although we have sold products and services to customers in over 120 countries historically, we believe we have additional opportunities in certain international markets. For example, in India, a market we currently serve through local partners, we intend to leverage our relationships with leading reactor design firms to capitalize on the opening of the nuclear end market to U.S. and European firms. Another such market is the European dosimetry services market. Through acquisitions, we have developed our presence in the Netherlands and Germany, and we plan to continue expanding into other European countries. Also in our Medical segment, our SunScan product, a cylindrical water scanning system for linear accelerator commissioning, received regulatory clearance in the European market in late 2023 which will drive additional market adoption.
•Customer outsourcing. We believe we will continue to capitalize on customer outsourcing within the nuclear end market. Within the United States, several NPP operators have recently outsourced their dosimetry services in order to reduce costs. We have been able to benefit from economies of scale as well as advantages in materials procurement and processing technology to provide enhanced dosimetry services to many of these NPPs at a lower cost.
•Service privatization. In regions outside the United States, dosimetry services have historically been provided by government agencies. However, privatization of dosimetry services is occurring in some regions, such as Europe. As illustrated by our acquisitions in the Netherlands and Germany, providers seek to reduce costs and benefit from enhanced service offerings. This provides us with an opportunity to leverage our expertise and North American service experience, where we have demonstrated a strong track record of success, to expand market share in other geographies. For the fiscal periods ended December 31, 2025, 2024, and 2023, service revenue represented approximately 25.4%, 25.3%, and 25.4%, respectively, of our consolidated revenue.
•Expand into new end markets. We periodically review our adjacent markets and identify opportunities for expansion. For example, we entered into the regulatory compliance market, while creating additional opportunities in the broader energy power markets, through the acquisition of Certrec in July 2025. Within Medical, we've extended our reach across the radiopharmaceutical lifecycle, working together with drug manufacturers to ensure the safety and efficiency of workflows for clinical utilization of radioisotopes.
Develop new products and services. We believe that significant near-term opportunities exist for us to develop new products and services by capitalizing on our understanding of our customers’ needs and requirements. Cross pollination of technologies between end markets also drives new growth opportunities as we leverage our Medical distribution channels to market and sell Nuclear & Safety products. In our Nuclear & Safety segment, supporting the development of small modular nuclear reactors (SMRs) continues to be a strategic focus. SMRs are expected to provide a safer, more flexible and cost-effective alternative in energy output, with up to 700 GWs of capacity expected by the year 2050.
Software and digital solutions: Another area of strategic focus is digital-forward roadmap inclusive of both on-premise and software as a service (SaaS) solutions. In 2025 we launched the first application of the award-winning Vital Platform - a single connected ecosystem for radiation safety instruments and software designed to break down information silos, surface critical insights, integrate seamlessly, and scale with ease. Likewise, key advancements to the Paragon HIPS platform and the suite of ec2 Software solutions underscores our commitment to simplifying the workflow and needs of our customer base.
Continuously improve our cost structure and productivity. As we continue to grow our business, we have implemented a coordinated program of ongoing operating improvements, such as optimizing our manufacturing footprint, rationalizing excess costs and minimizing working capital requirements. We are continuously implementing our business system principles to challenge our practices and improve our performance across all our businesses. In 2025, we advanced supplier consolidation and channeled a greater share of spend through a more concentrated group of strategic suppliers. These actions are supporting sustainable value creation.
Pursue strategic acquisitions and other transactions. Between 2016 and 2025, we acquired 18 companies, including the acquisitions of Certrec and Paragon in 2025. The objective of these acquisitions was to complement our portfolio, reinforce our supply chain and expand into new markets such as nuclear imaging and radiation therapy. We continuously monitor potential acquisitions and intend to further complement our organic growth with selective acquisitions that enhance our existing products and services, strengthen our position with existing customers and enable us to expand into new markets.
12
From time to time we also divest businesses as part of a process to streamline our operations and focus our resources on certain more strategic markets.
Remaining Performance Obligations
Total remaining performance obligations represents committed but undelivered contracts and purchase orders at period end. Remaining performance obligations excludes maintenance-related activity and agreements that do not represent firm purchase orders. Customer agreements that contain cancellation for convenience terms are not reflected in remaining performance obligations until firm purchase orders are received. Remaining performance obligations is not a complete measure of our future business due to these customer agreements. Our customers may experience project or funding delays or cancel orders due to factors beyond our control. If customers terminate, reduce or defer firm orders, whether due to fluctuations in their business needs or purchasing budgets or other reasons, our sales will be adversely affected and we may not realize the revenue we expect to generate from our remaining performance obligations or, if realized, the revenue may not translate into profit. Remaining performance obligations can fluctuate significantly due to the timing of large project awards. In addition, annual or multi-year contracts are subject to rescheduling and cancellation by customers due to the long-term nature of the contracts.
Information on remaining performance obligations (in millions):
| December 31, 2025 | December 31, 2024 | ||||||||||
Remaining performance obligations | $ | 1,104.3 | $ | 811.9 | |||||||
Deferred contract revenue | $ | 112.3 | $ | 96.6 | |||||||
Approximately 49% of our remaining performance obligations as of December 31, 2025 are expected to be recognized in calendar year 2026.
Competition
The global markets for our products and services are competitive and continually evolving. Within each of our operating segments, we encounter a variety of competitors, ranging from small independent companies providing niche solutions to larger multinational corporations providing a broader set of products and services to our targeted end markets. We believe that the principal bases upon which we compete in our target end markets include product quality and reliability, technical capability and product qualification, strength of customer relationships, customer service and price. In particular, customers in the defense and nuclear end markets tend to emphasize product quality and reliability, technical capability and strength of supplier relationships, while customers in the medical end markets, in particular for passive dosimetry products and services, tend to make purchasing decisions based on a combination of brand recognition, price, service and reliability.
We believe the primary competitors in each of our segments are as follows:
•Nuclear & Safety: Thermo Fisher Scientific, Curtiss-Wright, Ortec (Ametek), FLIR (Teledyne), Ludlum, Fuji Electric, Caen System, Fluke (Fortive), Berthold Technologies and Framatome
•Medical: Landauer (Fortive), PTW, IBA, Standard Imaging, Comecer and LAP
Research and Development
Our research and development efforts allow us to introduce new products to the marketplace, fulfill specific customer needs and continue to meet qualification requirements and other evolving regulatory standards. Our Nuclear & Safety and Medical segments are committed to both technology research and product development to fulfill their strategic objectives and are supported by our engineering and research and development organization consisting of about 172 software engineers, 362 scientists, technicians, and other engineers, representing approximately 16% of our total workforce, as of December 31, 2025. A number of these individuals participate in international standards setting organizations and committees. We have 264 resources tied to our managed services provider that supplies support across 4 platforms and IT. In addition, we augment our internal software teams with 10 experienced researchers, 4 software engineers and 12 IT resources supporting our service now transformation. We engage in research and development activities at most of our facilities worldwide. Our research and development expenses were $38.9 million for the fiscal year ended December 31, 2025, $35.0 million for the fiscal year ended December 31, 2024, and $31.7 million for the fiscal year ended December 31, 2023.
13
Sales and Marketing
We sell our products and services through our direct sales organization and indirectly through our global network of independent, third-party sales representatives and distributors. Our internal sales team is organized by operating segment and end market to provide a higher level of service and understanding of our customers’ unique needs. We have 49 sales offices throughout North America, Europe and Asia, and as of December 31, 2025, our sales and marketing personnel consisted of 324 employees, which represents approximately 10% of our total workforce.
We derive a portion of our revenue from sales of our products and services through channel partners, such as independent sales representatives and distributors. In particular, our independent sales representatives are an important source of sales leads for us and augment our internal resources in remote geographies. We sell through distributors in situations in which our customers prefer to purchase from a local business entity or purchase in smaller volume.
Our marketing activities include participation in many trade shows worldwide across our defense, medical and nuclear end markets. We advertise in technical journals, publish articles in leading industry periodicals and utilize digital and direct mail campaigns. We also regularly host webinars, in-person seminars and user meetings to directly engage our customer base. Our annual Mirion Connect User Meetings brings together customers from various segments to learn, exchange ideas discuss occupational challenges and network.
Our Customers
Our principal customers include power and utility companies, reactor design firms, NPPs, hospitals, clinics and urgent care facilities, dental offices, veterinary offices, radiation treatment facilities, OEMs for radiation therapy, laboratories, military organizations, government agencies, and industrial companies, We have long-standing relationships with our customers. For the fiscal years ended December 31, 2025, December 31, 2024, and December 31, 2023, no customer accounted for greater than 5% of our consolidated revenue, our top five customers together accounted for approximately 13%, 11%, and 12% of our consolidated revenue, respectively, and our top ten customers represented approximately 19%, 17%, and 19% of our consolidated revenue, respectively.
Manufacturing and Supply Chain
Given the diversity of our products, we employ numerous manufacturing techniques, including high-volume process manufacturing, discrete manufacturing, cellular manufacturing and hybrid approaches. Our production personnel engage in manufacturing, services, procurement and logistics activities. Our production activities are located in the United States, Canada, France, Germany, Belgium, Estonia, Finland and the United Kingdom. As of December 31, 2025, our production personnel consisted of 1,864 employees, which represents approximately 57% of our total workforce.
Our manufacturing activities are focused mainly on the production of the core value-add devices and components of our products, while non-core components and sub-assemblies are generally outsourced. We apply rigorous quality control processes and calibrate radiation detection devices internally, leading to high quality standards and customization capabilities. Most of our production sites are certified to production quality standards such as those of ISO 9001, the U.S. Nuclear Regulatory Commission (10 C.F.R. 50 Appendix B), the American Society of Engineers (ASME NQA-1), the American Society of Mechanical Boiler Pressure Vessel Code Section III, Canadian Standards Association N299 1-4 (supply of items and services to nuclear power plants), and ISO19443 (in France).
The principal materials used in our manufacturing processes are commodities that are available from a variety of sources. The key metal materials used in our manufacturing processes include precious metals (such as rhodium), lead, tungsten, copper, aluminum, magnesium products, steel, stainless steel and various alloys, which are formed into parts such as detectors, sensors, metal housings and frames, and cable assemblies. The key non-metal materials used in our manufacturing processes include amorphous and crystalline scintillator materials, ceramics, epoxies, silicon and fused silica, polyethylene, polyurethane and injection molded plastic parts and components such as lenses, monitors, sensors, dosimeters, electronic boards, detectors and cables. We also use lead shielding both to protect people and objects from radioactive sources that is or will be incorporated into our products, and also to protect certain detectors against the “noise” that may be created by background radiation.
Intellectual Property
The success of our business depends, in part, on our ability to maintain and protect our proprietary technologies, information, processes and know-how. We rely on a combination of intellectual property rights, including trade secrets, patents, copyrights and trademarks, as well as contractual protections, to protect our proprietary products, methods, documentation and other technology.
14
As of December 31, 2025, we own approximately 78 issued U.S. utility patents, 105 issued foreign utility patents (including in Canada, the European Union, Russia, China and Japan), 12 pending U.S. utility non-provisional patent applications, 16 pending foreign utility patent applications (including in the European Union and France) including pending Patent Cooperation Treaty, or PCT, patent applications. These issued patents are expected to expire between 2026 to 2038 and these pending applications, if issued, are expected to expire between 2039 to 2040, in each case without taking into account any possible patent term adjustment or extensions and assuming payment of all appropriate maintenance, renewal, annuity, or other governmental fees. We do not expect the expiration of any of the patents that are scheduled to expire in 2026 to have a material impact on its business. These patents include five co-owned issued U.S. patents and twenty-six co-owned issued foreign patents. We also hold exclusive and non-exclusive licenses related to patents and other intellectual property of third parties. We also own trademark registrations or registration applications in the United States and in certain foreign jurisdictions.
Nuclear & Safety Segment
As of December 31, 2025, we own approximately 35 issued U.S. utility patents, 69 issued foreign utility patents (including in the European Union, Canada, Russia and Japan), 9 pending U.S. non-provisional utility patent application and 11 pending foreign utility patent applications (including pending PCT patent applications) that contain claims directed to products in our Nuclear & Safety segment, including our alpha/beta counting instruments, contamination and clearance monitors, gamma spectroscopy software and detector systems, NDA and waste measurement systems, portable radiation measurement instruments, radiation monitoring systems and reactor instrumentation and controls products. Our issued patents are expected to expire between 2026 to 2037 and our pending applications, if issued, are expected to expire between 2032 to 2040, in each case without taking into account any possible patent term adjustment or extensions and assuming payment of all appropriate maintenance, renewal, annuity, or other governmental fees.
In many instances (for both the Medical and Nuclear & Safety Segments), we rely on trade secret protection and confidentiality agreements to safeguard our interests. Due to the long useful life of certain aspects of our technology, we believe that the patent registration process, which requires public disclosure of patented claims and inventions, could harm our competitive position. We differentiate our products and technologies primarily through our proprietary know-how, technology or data that are not covered by patents or patent applications, including technical processes, equipment designs, testing and other procedures. Our employees are generally required to assign to us all of the inventions, designs and technologies they develop during the course of employment with us, either through written agreements or by operation of law, depending on the jurisdiction. Where appropriate, we require third parties with whom we deal to enter into agreements with us that address issues of confidentiality and intellectual property. For a discussion of the risks and uncertainties affecting our business related to our protection of intellectual property and other proprietary information, please see “Part I, Item 1A. Risk Factors—Legal and Regulatory Risks.”
Medical Segment
As of December 31, 2025, we own approximately 43 issued U.S. utility patents, 36 issued foreign utility patents (including in the European Union, China, Japan and Canada), 3 pending U.S. non-provisional utility patent applications and 5 pending foreign utility patent application in the European Union that include claims directed to products in our medical segment, including our cancer diagnostics and therapeutics QA, occupational dosimetry, medical imaging and nuclear medicine equipment products. These issued patents are expected to expire between 2026 to 2038 and these pending applications, if issued, are expected to expire between 2039 to 2040, in each case without taking into account any possible patent term adjustment or extensions and assuming payment of all appropriate maintenance, renewal, annuity, or other governmental fees.
Seasonality
General economic conditions impact our business and financial results, and our business experiences seasonal and other trends related to the industries and end markets that we serve. Our highest volume of sales and cash flows occurs in the fourth quarter of the fiscal year due in large part to the timing of customers’ capital spending programs and increased outages occurring in the fall in our Nuclear & Safety segment. In addition, while we believe that we are poised for growth from governmental customers in both of our segments, our revenues and cash flows from government customers are influenced, particularly in the short-term, by budgetary cycles. This impact can be either positive or negative.
For more information about the trends that impact our business and financial results, see “Part I, Item 1A—Risk Factors—Risks Related to Our Business and Industry—Our results of operations may fluctuate significantly, which could make our future results difficult to predict and could cause our results of operations to fall below expectations.”
15
Government Regulation
Our current and contemplated activities, and the products that result from such activities, are subject to substantial government rules and regulations, both in the United States and in other countries, addressing, among other things, products approvals, manufacturing, testing, qualifications, certifications, labeling, marketing, promotion, export, import, distribution and sale, and disposal.
Environmental Regulations
We use, generate, discharge and dispose of hazardous substances, chemicals and wastes at some of our facilities and are subject to various laws and governmental regulations concerning environmental matters and employee safety and health in the United States and other countries. Historically our capital expenditures, earnings and competitive position have not been materially affected by our compliance with environmental regulations however those regulations are subject to change, and we monitor developments carefully.
Trade Controls
Our products and technologies are subject to export and import controls under United States, Canada, France, the United Kingdom and European Union laws. Export licenses, permits or other authorizations from government export control authorities may be required depending on the product, technology, destination, end-user and end-use. In addition, United States laws and regulations implemented by the U.S. Treasury Department’s Office of Foreign Assets Control (“OFAC”) impose economic sanctions on certain countries, business entities and individuals.
Anti-Corruption Laws
We are subject to anti-bribery and anti-corruption laws, including the U.S. Foreign Corrupt Practices Act (the “FCPA”), the United Kingdom Bribery Act (the “UKBA”), and anti-corruption laws enacted in various other countries.
Privacy and Information Security Laws
In the ordinary course of our business, we collect, store, use, transmit and process certain types of data, including personal information, subjecting us to privacy and information security laws in the United States and internationally, including the EU General Data Protection Regulation (“EU GDPR”), the EU AI Act Regulation 2024/1689, and other laws, rules and regulations designed to regulate the processing of personal information. These laws impose obligations with respect to the collection, processing, storage, disposal, use, transfer, retention and disclosure of personal information. Privacy and information security laws evolve regularly, and complying with these evolving laws, rules, regulations and standards could cause us to incur substantial costs that are likely to increase over time, requiring us to adjust our compliance program on an ongoing basis and presenting compliance challenges, change our business practices in a manner adverse to our business, divert resources from other initiatives and projects, and restrict the way products and services involving data are offered.
Medical Device Regulation
We are required to register for permits and/or licenses with, obtain approvals from and comply with operating standards of the U.S. Food and Drug Administration (the “FDA”), the U.S. Department of Health and Human Services (“HHS”), the European Medicines Agency (the "EMA”), the U.K. Medicines and Healthcare Products Regulatory Agency (the "MHRA"), and other foreign agencies.
Our medical devices are subject to regulation under the U.S. Food, Drug, and Cosmetic Act (the “FDCA”), including design, development, testing, manufacturing, marketing, distribution, and recordkeeping. We must also comply with post-market surveillance regulations and adverse event reporting requirements.
We are subject to various U.S. federal healthcare related laws regulating fraud and abuse, research and development, pricing and sales and marketing practices, and the privacy and security of health information such as the U.S. Federal Anti-Kickback Statute, the Health Insurance Portability and Accountability Act of 1996 (HIPAA), and the False Claims Act. Similar laws and regulations may apply in foreign countries.
16
Federal consumer protection and unfair competition laws broadly regulate marketplace activities and activities that potentially harm consumers. Analogous U.S. state laws and regulations, such as state anti-kickback and false claims laws, also may apply to our business practices, including research, distribution, sales and marketing arrangements, and claims involving healthcare items or services reimbursed by any third-party payor, including private insurers. Further, there are state laws that require medical device manufacturers to comply with the voluntary compliance guidelines and the relevant compliance guidance promulgated by the U.S. federal government, or otherwise restrict payments that may be made to healthcare providers and other potential referral sources; state laws and regulations that require manufacturers to file reports relating to pricing and marketing information, which requires tracking gifts and other remuneration and items of value provided to healthcare professionals and entities; state and local laws requiring the registration of sales representatives; and state laws governing the privacy and security of health information in certain circumstances, many of which differ from each other in significant ways and often are not preempted by HIPAA. Similar laws and regulations apply in many non-U.S. countries.
Human Capital Resources
We are committed to our people and aim to be an employer of choice in the industries in which we operate. Our culture is team-based and progressive; our core values are central to how we operate as a company.
As of December 31, 2025, we employed 3,281 full-time and part-time employees. We also use temporary or contract workers who totaled approximately 128 as of December 31, 2025, on a full-time equivalent basis. Of these, approximately 1,767 were employees in the United States and 1,514 were employees outside of the United States. Some of our operations are subject to union contracts, with 3 unions active in the United States as of December 31, 2025. Approximately 1.4% of our workforce is covered by collective bargaining agreements.
We are committed to fostering a workplace that attracts and retains exceptional talent. We value teamwork, practicing intellectual honesty and candor. We support a wide range of backgrounds, experiences and perspectives in our workforce and promote an engaging workplace that encourages participation of all employees.
Employee Engagement
We regularly conduct employee engagement surveys to collect feedback to better understand and improve our employees' experience and identify opportunities to strengthen our culture. Through these surveys, town halls, emails and other platforms, we hear directly from employees on what is working well, what we can do better, and how well our employees understand and are practicing our values. As part of our annual employee development program, frequent check-ins occur between employees and their managers tied to key human capital measures and objectives. We frequently report employee engagement results to our Board of Directors to drive action in response to employee feedback.
Employee Compensation and Benefits
We require a talented workforce and are committed to providing total rewards that are market-competitive and performance-based, driving innovation and operational excellence. Our compensation programs, practices and policies reflect our commitment to reward short- and long-term performance that aligns with, and drives, stockholder value. Total direct compensation is generally positioned within a competitive range of the relevant market median, with differentiation based on tenure, skills, proficiency, and performance.
In addition to providing competitive compensation, another part of our strategy to attract and retain high-performing employees is to offer a variety of benefits to further their personal and professional development. In the U.S., these include:
•Comprehensive medical, dental and vision coverage for employees and their families
•A 401(k) plan with an employer match of up to 4% for eligible employees
•PTO programs, including parental leave, personal sick and bereavement time off
•Workplace support for families and children such as childcare benefits including dependent care assistance via employee flexible spending accounts and access to an employee assistance program
•Eight hours of paid volunteer time off for eligible employees
In other jurisdictions, we provide similar or other benefits adapted to local practices.
17
Training and Development
Human capital development underpins our efforts to execute our strategy and continue to design, manufacture and market innovative products and services. The professional development of our employees is critical to this success. We invest in our employees’ career growth and provide employees with a wide range of development opportunities, including but not limited to mentoring, product and sales training, as well as compliance training including on the topics of cybersecurity, artificial intelligence and other workplace safety training.
Employee Health and Safety
As a company that sells solutions to keep others safe, we place great focus on the safety of our own employees. We are committed to providing a safe and healthy work environment. Safety is a key consideration in our manufacturing processes. We are deliberate in designing programs to protect our employees and mitigating potential workplace incidents that could arise. All facilities are expected to comply with local safety laws and regulations. Additionally, each site maintains comprehensive safety programs, including corrective action processes and emergency response plans. Employees undergo regular health and safety training to ensure compliance with, and communication of, safety policies and procedures. Material occupational health and safety incidents are reported to our Risk Management Committee which monitors safety performance across the Company. We are continuously assessing risk and looking to improve our processes in an effort to prevent safety incidents.
Ethics and Corporate Responsibility
We are committed to ensuring that our employees conduct our Company’s business with the highest levels of ethics and corporate governance. In 2023, we published our inaugural Corporate Social Responsibility Report detailing our focus and commitment to continuing to grow as a responsible company, and it was updated in 2025. We maintain an Anti-Bribery and Corruption Policy and conduct regular training on bribery and corruption. We provide an ethics hotline supported by a Whistleblower Policy outlining information, procedures and non-retaliation guidelines for reporting suspected violations of our Code of Ethics, policies or procedures. We also publish a Human and Labor Rights Statement outlining expectations with regard to respecting the dignity of our employees and all persons involved in the Company’s business.
Available Information
Our website is www.mirion.com. The information found on, or that can be accessed from, or that is hyperlinked to, our website is not part of this Annual Report on Form 10-K. We file or furnish Annual Reports on Form 10-K, Quarterly Reports on Form 10-Q, Current Reports on Form 8-K, including exhibits, amendments to these reports and other information with the United States Securities and Exchange Commission (“SEC”). You may obtain a copy of any of these reports, free of charge, from the Investor Relations section of our website as soon as reasonably practicable after we electronically file such material with, or furnish it to, the SEC. The SEC maintains an Internet site that also contains these reports at: www.sec.gov.
18
TEM 1A. RISK FACTORS
We operate in complex markets and regulatory environments and that involves significant risk. You should carefully consider the following risk factors before making an investment decision as they may have an adverse effect on our business, results of operations and financial condition:
•Risks Related to Our Business and Industry
•Risks Related to Our Business Operations
•Legal and Regulatory Risks
•Capital Structure Risks
These risks are not the only risks we face but represent known risks we believe are material. Additional risks and uncertainties not currently known to us, or that we currently deem to be immaterial, could also materially adversely affect our business, results of operations and financial condition or future results.
Risks Related to Our Business and Industry
We have incurred operating losses in the past and we cannot yet assure you we will always achieve positive net income. As of December 31, 2025, we had an accumulated deficit of $512.7 million. For the years ended December 31, 2025, December 31, 2024, and December 31, 2023, we experienced net income (losses) of $29.8 million, $(36.6) million, and $(98.7) million, respectively. Our prior year losses were significantly impacted by the amortization of intangible assets established as part of the GSAH acquisition. We cannot yet assure you that we will always achieve positive net income, but our results from the last three fiscal years have trended favorably. We continuously seek to reduce operating costs through lean initiatives, supply chain management and optimizing our capital structure but our plans could be impacted by events outside of our control including rising inflation. If our revenue and gross profit growth do not outpace the growth of our operating expenses, we may not achieve and maintain positive net income.
Our results of operations may fluctuate significantly and cause our results of operations to fall below expectations. Our financial performance is subject to fluctuations due to varying demand for our products and services across our core markets. Demand for our solutions in these markets has fluctuated due to a variety of factors, many of which are beyond our control. Sales and cash flow typically peak in the fourth quarter of the fiscal year, reflecting customers’ spending cycles and increased outages occurring in the fall in our Nuclear & Safety segment. This has caused our results of operations to fluctuate. The nuclear sector has recently seen a resurgence in demand, driven by an overall increase in electricity demand from a number of sources, including electric cars, the anticipated infrastructure build of data centers for artificial intelligence, and other sources. This presents both opportunities if the additional electricity demand is supplied by nuclear power plants (“NPPs”) and risks if demand is lower than expected or electricity is produced by other means. This has caused and we expect it will continue to cause our results of operations to fluctuate. See also “Risks Related to Our Business and Industry—Our sales cycles in certain end markets can be long and unpredictable.”
19
Our operating results may be impacted by the effects of, and changes in, worldwide economic conditions, international trade, tariffs and retaliatory countermeasures, export controls and other trade barriers, global trade wars or domestic preferences which could increase our costs and materially and adversely affect our business, results of operations and financial condition. Our global business, operations, and the execution of our business strategies and plans are subject to global competition and economic and geopolitical risks that are beyond our control, such as, among other things, tariffs and retaliatory countermeasures, trade barriers and other governmental protectionist measures impacting international trade agreements or imposing trade restrictions, any of which can negatively affect us. The global economy has been impacted by geopolitical tensions. There is currently significant uncertainty about future trade relationships between the United States and various other countries, most significantly Russia, Canada, Mexico, and China. Further escalation of specific trade tensions, including those between the U.S. and China, or more broadly in global trade conflicts, could materially and adversely affect the Company’s business and operations. The U.S. government and other governments have imposed export controls and tariffs on certain products and certain components that we import into, and export out of, the United States, and we, our customers, suppliers, and partners may become subject to additional tariffs and export controls and our products and services may be subject to increased competition outside of the United States. In addition, geopolitical tensions could result in, among other things, cyberattacks, supply chain disruptions, higher energy and other commodity costs, lower demand, changes to foreign exchange rates and financial markets. Additional tariffs and trade restrictions may result in increased manufacturing costs and product pricing, further supply chain disruptions, limit access to end markets and lower profitability. We also generate a significant amount of our revenue outside of the United States which may be adversely affected by tariffs and trade controls imposed by other countries. Revenue generated from outside of North America accounted for approximately 37.1% of our net sales for the year ended December 31, 2025, and approximately 37.0% of our net sales for the year ended December 31, 2024, and international sales are expected to remain a material percentage of our total revenue in future periods. If we are not successful in offsetting the impact of tariffs, export controls, trade barriers, and other geopolitical disruptions, our business, results of operations and financial condition may be adversely affected.
Following the Paragon acquisition, our growth strategy relies in part on plans to supply our products and services to SMRs and other advanced reactors in the U.S., an emerging market that may grow more slowly than we expect. Our Nuclear and Safety growth strategy relies on market research that estimates that the market for SMRs will surge, driven by a global growth in energy, and specifically electricity demand, and we have accordingly pursued entering into strategic agreements with a number of SMR companies in the U.S. However, these companies face multiple commercialization obstacles including reactor design, regulatory licensing, and securing customers willing and able to make large investments in emerging nuclear technologies. Each SMR developer faces unique risks, including risks related to technology, regulatory approvals, and financing. Even for those SMR companies that succeed, the cost curves that will be required for successful commercialization at scale will be aggressive and competition will be fierce among them, and also from other cost-competitive energy solutions. Further, many of these SMR companies are new entrants to the nuclear market and may fail operationally even if they develop a successful reactor, which may negatively impact the entire market. Our assumptions, estimates and plans about the SMR market may not be correct or they may change at any time, and our revenue may be subject to volatility as our SMR partners succeed, delay or cancel their projects, or fail altogether, which could cause material and adverse impacts on our business, results of operations and financial condition.
International conflicts, such as the military conflict between Russia and Ukraine have adversely affected and may further adversely affect our business, results of operations, and financial condition. We do business with Russian customers both within and outside of Russia and with customers who have contracts with Russian counterparties. Russia’s invasion of Ukraine, the ensuing build-up of Russian sanctions and other impacts on this region have impacted the global economic environment resulting in fluctuating demand for our products and services, delays or cancellations of customer projects and difficulties in supplying and sourcing products from this and other geographic regions. We have also experienced and may continue to experience delays in revenue recognition, order fulfillment and contract payments due to export controls and other sanctions instituted to date. A number of nuclear power plants are being constructed or are operated by or with the participation of Russian state-owned enterprises. As the situation evolves, there is a growing risk that those Russian state-owned enterprises could become further sanctioned by the United States or the European Union. We also sell medical equipment and related products into Russia for medical and humanitarian applications, however this process has become more complicated, time consulting and uncertain as some of our medical equipment exports require export licenses. We may also be subject to criticism for continuing to sell products to Russia, which could damage our reputation and adversely affect our business, results of operations and financial condition. It has become more difficult to transact with Russian parties due to the continued expansion of U.S. and EU sanctions directed at Russia.
In April 2023, a Russian customer claimed $19.3 million in liquidated damages for delays on a Hungarian project, later increasing the claim to $21 million, despite a $14 million contractual cap (all amounts converted from Euros to U.S. Dollars). In November 2024, the parties reached a settlement and agreed to modify the contract. The parties are now working on implementing the terms of the settlement which is complicated by the current sanctions regime. The modification was accounted for under ASC 606 Revenue Recognition which resulted in an immaterial impact to the Statement of Operations for the year ended December 31, 2024.
20
We have made and plan to continue to make acquisitions, investments and divestitures that involve numerous risks and uncertainties. We pursue growth by selectively acquiring and investing in, businesses, products or technologies, while also divesting businesses that no longer align with our strategic plans. However, there can be no assurance that suitable opportunities will be identified or that transactions will close on favorable terms. The expected benefits may not materialize, and such activities can introduce risks, including competition for attractive or promising businesses or assets, financing needs, and regulatory approvals. Financing acquisitions through equity or debt may dilute our stockholders or increase financial obligations. Divestitures can be time consuming, disruptive our business, may not close on the expected timing or at all, have in the past resulted in additional costs following the transaction and may continue to do so in the future. Potential and actual transactions could also divert management's attention, and could potentially deplete corporate resources and adversely impact the Company’s business, results of operations and financial condition.
In July 2025 and December 2025 we acquired Certrec and Paragon, respectively. These acquisitions may not meet our expectations. Their success, including anticipated benefits, will depend, in part, on our ability to successfully integrate our respective organizations without materially disrupting existing business and strategic relationships. If we experience difficulties in the integration process, we may not fully realize the anticipated benefits of the acquisitions in a timely manner, or at all.
We operate in an industry where risks related to radioactive materials and public views on nuclear energy could materially and adversely affect our markets and increase regulatory requirements and costs, negatively impacting our business, results of operations and financial condition. Risks related to radioactive materials and public views on nuclear energy can significantly impact our business. Our success in the nuclear power end market depends on favorable public opinion of nuclear energy. Opposition from various groups or a nuclear incident could lead to unfavorable public opinion, stricter regulations, higher costs and reduced customer demand for our products thereby materially and adversely affecting our business, results of operations and financial condition.
Supply chain issues could disrupt production, cause delays and increase costs for the commodities or components that we use in our operations which may materially and adversely impact our business, results of operations and financial condition. We rely on third party suppliers for our manufacturing operations including from sole or limited source suppliers due to quality assurance, cost effectiveness, availability, contractual obligations or unique design or technology. This dependence exposes us to risks like price volatility, supply disruptions, and geopolitical issues as suppliers are often located in developing countries. Suppliers capacity constraints, operational or quality issues, bankruptcies or other business terminations, decreased availability of key materials, and external events like natural disasters, pandemics, war, terrorism, tariffs wars and other governmental actions can make it difficult to find replacements quickly or at similar costs. Such disruptions could cause increased expenses, production interruptions, delays, extended lead times, and inefficiencies, and adversely impact our business, results of operations and financial condition.
Our sales cycles in certain end markets can be long and unpredictable. The sales cycle for new construction or refurbishment of existing NPPs ranges from 12 to 36 months and occasionally extends up to 60 months or more, while medical end market cycles range from 1 to 18 months. We invest heavily before securing orders, with no guarantee of a sale. Revenue recognition may be delayed due to the need for customer notices to proceed, certification of successful installation and operation, or construction or scheduled outage delays, making revenue predictions difficult, particularly on a quarterly basis, and can cause our operating results to fluctuate significantly.
Many of our products and services involve the detection, identification, measurement or monitoring of radiation and the failure of our products or services to perform to specification could materially and adversely affect our business, results of operations and financial condition. Our products and services are technically complex, involve the detection and monitoring of radiation and are crucial components of the safety measures employed with respect to ionizing radiation. Any actual or perceived quality issues or safety failures could result in incorrect medical treatments, personal injury, death or property damage (including environmental contamination). Resulting legal claims and regulatory actions could generate significant costs to us. Product issues could adversely affect our reputation and customer relationships. While we have attempted to secure appropriate insurance coverage at a reasonable cost, we may not be fully covered against all risks and we are also subject to significant deductibles. There can be no assurances that insurance policies will continue to be available on commercially acceptable terms or at all. We seek to limit our liability in customer contracts, but these contractual limitations may not always be effective or sufficient in scope in all cases, which could subject us to material and adverse impacts on our business, results of operations and financial condition.
21
Certain of our products require the use of radioactive sources or incorporate radioactive materials, which subjects us and our customers to regulations, related costs and potential liabilities for violation of environmental, health and safety laws. The majority of our products require the use of radioactive sources for testing and calibration, which are held in our facilities and by our customers. Certain of our reactor instrumentation and control equipment and systems also incorporate radioactive materials. In all such cases, licenses for radioactive sources and materials or other sources ionizing radiation are provided by the appropriate regulatory authority in the relevant jurisdiction. Failure, to secure or comply with the necessary licenses could result in purchase cancellations, delays, or regulatory actions. Licensing processes generally require safety policies and procedures, emergency plans, proper handling and disposal procedures and adequately training personnel at the site. Ongoing compliance obligations include paying license fees, submitting reports, and agree to site inspections by regulators. Non-compliance or improper handling of radioactive materials can result in license revocation, which could result in the cancellation or delay of purchases by our customers, penalties, fines and liability for accidents or contamination. Related claims for related violations of environmental, health and safety laws could result in substantial damages, be costly and time-consuming to defend and adversely affect the marketability of our products, our reputation, our results of operations and financial condition.
We enter into fixed-price contracts and contracts with limited pricing escalation and our failure to mitigate certain risks associated with such contracts may result in reduced operating margins. For NPPs new builds, we periodically enter into fixed-price arrangements and contracts with price escalation terms that may not fully cover all possible cost increases. The actual revenue, cost and gross profit from these contracts can differ substantially from original projections due to factors including inaccurate costs estimation, inflation, currency fluctuations, design error, technical problems, supplier failures, regulatory delays, customer issues, changes in laws, construction delays, limited history with new products and customers, contract termination, or other unanticipated circumstances. We may experience cost overruns due to these factors resulting in losses or reduced profitability which could materially and adversely affect our business, results of operations and financial condition.
Risks Related to Our Business Operations
We derive a significant portion of our revenue from international sales and our operations in non-U.S. countries are subject to political, economic, legal, currency and other risks, which could materially and adversely affect us. Revenue generated from outside of North America accounted for approximately 37%, 37%, and 36% of our net sales for the years ended December 31, 2025, December 31, 2024, and December 31, 2023, respectively. International sales are expected to remain a material percentage of our total net sales in future periods. Our operations are subject to risks such as currency fluctuations, complex non-U.S. laws and regulations, new or increased tariffs, and the need for government approvals and certifications. We must also manage localization requirements, export/import licenses, and challenges in collecting payments. Additional risks include protecting our intellectual property, staffing and managing international operations, and overseeing third party sales agents and distributors. Contract management, restrictions on cross-border fund transfers and tax consequences add further complexity. Regional political and economic instability can also impact operations. All these factors could materially and adversely affect our business, results of operations and financial condition.
Unfavorable currency exchange rate fluctuations could materially and adversely affect our financial results.
Our international sales and our operations in countries other than the United States expose us to risks associated with fluctuating currency values and exchange rates which may exacerbate if trade wars escalate. A significant amount of our international sales, costs, assets and liabilities are denominated in currencies other than the U.S. dollar. Gains and losses on the conversion of accounts receivable, accounts payable and other monetary assets and liabilities to U.S. dollars have contributed and may continue to contribute to fluctuations in our results of operations. In addition, continued increases in the value of the U.S. dollar relative to the Euro could have an adverse effect on our results of operations. We do not currently purchase forward contracts to hedge against the risks associated with fluctuations in exchange rates.
We rely on third-party sales representatives to assist in selling our products and services, and their failure to perform as expected could materially and adversely affect us. A significant portion of our revenue is derived from sales through third-party sales representatives e.g., sales agents and distributors, whose success in marketing and selling our products and services is unpredictable. Additionally, many of these representatives also market and sell competing products and services, potentially impacting their promotion of our products and services. If they misrepresent our products, we could become subject to risk or liability from government regulatory bodies or agencies for criminal or civil claims, including false claims and improper advertising and promotion. Furthermore, violations of laws or regulations, in particular, anti-corruption, environmental, or sanctions laws, by these representatives could be imputed to us and result in adverse publicity, fines, penalties, judgments, money damages and other significant losses, any of which could adversely affect our business, results of operations and financial condition.
22
We derive a substantial portion of our U.S. revenue from contracts with U.S. governmental customers or their contractors, and any shutdown or other development where such customers may be required to reduce their spending, cancel contracts, initiate audits and investigations, or require unusual or more onerous contractual terms could materially and adversely affect us. A substantial portion of our business relies on government budgets and spending, such as nuclear power plants and medicine. Revenue is often tied to government customers or their contractors or sub-contractors. Any reduction in government funding, such as a shutdown, failure to raise the debt ceiling, or general budget cuts could reduce our sales and revenue. Changes in capital spending policies or increased scrutiny of government budgets could also reduce demand and could also result in audits and investigations. Even when selling to non-government entities, we must comply with strict procurement processes for government contractors and subcontracts, in particular in the United States. European Union and United Kingdom. Bids for government contracts may require security clearances with the Department of Defense or Department of Energy, or compliance with regulations like the Buy-American Act. Obtaining and maintaining security clearances is a lengthy process and may be denied or revoked. Recruiting qualified employees for these clearances can be difficult. We are subject to government audits and investigations which can result in financial penalties and debarment, financial penalties, contract delays, or loss of business if adverse findings occur. Increased government spending cuts may lead to more audits. Failure to meet requirements (security clearances, product qualifications, audit standards) could result in contract termination, penalties and loss of future business opportunities, any of which could adversely affect impact our business, results of operations and financial condition.
We operate as an entrepreneurial, decentralized company reliant on local business units which could materially and adversely affect our business, results of operations and financial condition. We operate in multiple countries and are subject to numerous, complex and frequently changing business conditions and regulatory environments. In addition, certain of our business teams are from time to time staffed leanly due to our growth-oriented organizational structure. If we are not able to detect or resolve financial, operational and compliance matters promptly, this could adversely affect our business, results of operations and financial condition.
The use of Artificial Intelligence (AI) and machine learning in our business and operations may result in legal liability, regulatory action, increased compliance obligations, competitive or reputational harm, ethical or other concerns and adversely affect our business, financial condition and results of operations. We leverage artificial intelligence, including generative artificial intelligence and machine learning in certain of our business operations and may also use products and services from third parties that use artificial intelligence technology. Our competitors or other third parties may incorporate artificial intelligence into their operational processes more quickly or more successfully than us, which could have a material adverse effect on our competitive position, reputation and operations. In addition, there are significant risks involved in developing and deploying artificial intelligence and there can be no assurance that our use of artificial intelligence will increase our efficiency or profitability or be beneficial to our business. Laws and regulations regarding artificial intelligence technologies are rapidly evolving and complex, including in the areas of intellectual property, cybersecurity, privacy and data protection. We have implemented policies and controls to mitigate many of the novel risks presented by these new technologies but compliance with new or changing laws, regulations or industry standards relating to artificial intelligence may impose significant costs and limit our ability to develop, deploy or use artificial intelligence technologies in our business. There has been an increase in artificial intelligence related litigation and government regulatory actions targeting the design, deployment and other uses of artificial intelligence and claiming liability under numerous areas of law, such a consumer protection, product liability, privacy, intellectual property, securities and defamation. Any of these risks could have an adverse effect on our business, results of operations and financial condition.
We have, and could continue to experience cyberattacks, intrusions into our systems by unauthorized parties or other data theft or loss, which could cause us to incur significant costs, and could also subject us to litigation, regulatory enforcement actions and damage to our reputation, any one of which could materially and adversely impact our business, reputation, results of operations and financial condition. We are facing increasing cybersecurity risks due to more aggressive and sophisticated attacks, including the rapid evolution and growing adoption of artificial intelligence and machine learning technologies by threat actors. These risks include hacking, computer viruses, malicious code, ransomware, social engineering attacks (including phishing and impersonation), denial-of-service attacks and machine learning algorithms and techniques that automate, accelerate or enhance cyberattacks. Our IT systems are subject to constant attempts to gain unauthorized access to, capture, destroy or manipulate confidential information and we have experienced, and may in the future experience, cyberattacks and data breaches. Additionally, the use of artificial intelligence by our employees, or by our customers and business partners, could increase our exposure to cyber threats. Despite the implementation of information security systems and processes to protect against unauthorized access, data loss and theft (see "Item 1C. Cybersecurity"), there is no guarantee that this governance will be adequate to safeguard against all breaches or misuse of our data and systems. Additionally, some confidential information and customer data is gathered, processed, and stored by third-party vendors or service providers whose security and protection policies and procedures we ultimately do not, and are unable to, control. We maintain private liability insurance intended to help mitigate the financial risks of such incidents, but there can be no guarantee that insurance will be sufficient to cover all losses related to such incidents or available on commercially acceptable terms or at all, and our exposure resulting from any unauthorized access
23
to, or use of our data and systems, could far exceed the limits of our insurance coverage for such events. Any significant data breach or misuse of confidential information may result in significant costs, litigation and regulatory enforcement actions, harm our reputation, and therefore, may have a material adverse impact on our business, reputation, results of operations and financial condition.
The loss of the services of our key personnel, including our executive officers, and our ability to attract, develop and retain key talent could materially and adversely effect our business and operations. The Company’s future success depends to a significant degree on the skills, experience and efforts of its executive management team and other key personnel. Losing any executive officer or lacking adequate succession plans for key personnel could have an adverse impact on our business and operations. The inability to attract, develop and retain qualified individuals, or a significant increase in the costs to do so, could adversely affect our business, results of operations and financial conditions.
If we encounter manufacturing problems, or if our manufacturing facilities do not continue to meet federal, state or international manufacturing standards, we may be required to adapt our manufacturing operations, which would result in delays and lost revenue. Our manufacturing and assembly processes are complex, involving multiple suppliers and regulatory requirements across different countries. Challenges include limited availability or qualified personnel and increased costs due to trade policy developments. For example, whole body monitors are produced exclusively in Ontario, Canada and disruptions at this site such as higher costs of imported materials and components would be difficult to remediate elsewhere because qualified personnel may not relocate or be found locally. This could result in production delays, reliance on third parties, and financial losses. Additionally, our manufacturing is subject to inspections and regulatory requirements, See "Risk Factors—Legal and Regulatory Requirements." Failure to comply could lead to enforcement actions, product recalls, civil or criminal penalties, or other sanctions, penalties, and negative publicity.
Our operations, and the operations of our suppliers, distributors or customers, could be subject to natural and man made disasters as well as the impact of governmental actions and regulations in response to such events, any of which could materially and adversely affect our business and increase our expenses. Extreme weather events such as winter storms, hurricanes, earthquakes, fires, flooding, hail and tornadoes could disrupt our operations, leading to reduced revenue and increased costs and expenses. For example, some of our facilities are located in areas with acute climate related risks, such as Florida and Texas. We also have climate-related risks for our operations outside of the United States, such as Europe. Depending on the location and severity of such events we could experience business interruptions, destruction of, or damage to, facilities or loss of life, any of which could materially and adversely affect our business, results of operations and financial condition. We could also be required to incur significant costs to report on, and enhance the resiliency of, our operations, infrastructure and supply chain in order to comply with government regulations addressing climate change. These additional expenses could place pressure on profit margins or require us to increase the price of our products and services potentially affecting demand and, consequently, our business, results of operations and financial condition.
Fluctuations in our effective tax rate, including as a result of changes in law or recent changes in our organizational structure, or adverse outcomes resulting from examination of our income tax returns, could materially and adversely affect our results of operations. As a global company we are subject to taxation in numerous jurisdictions. Several factors, many beyond our control, could adversely affect our effective tax rate. These include changes in profitability across jurisdictions; inability to use tax credits; evolving tax laws and regulations, such as OECD Pillar Two legislation enacted in various countries in which we do business; non-deductible expenses; tax effects on acquisitions and restructuring; changes in deferred tax assets; results of tax audits and decisions regarding the reinvestment of foreign earnings. Any of these could significantly alter our effective tax rate, impacting our business, results of operations and cash flows.
24
Legal and Regulatory Risks
We are subject to extensive laws and regulatory regimes and any failure to comply with them could subject us to penalties and legal expenses which could materially and adversely affect our business, results of operations, revenue, supply chain and financial condition. The Company operates under extensive regulation by various federal, state, and local governmental agencies in the United States and other countries in which we conduct business covering areas such as radioactive materials, antitrust, environmental, health and safety, food and drug, medical device, import/export, and labor laws. Noncompliance may result in investigations, penalties, sanctions, prosecution, enforcement actions by governments or claims from other third parties, damages, fines, settlements, injunctions or debarment from government contracting or subcontracting. Separately, compliance with anti-corruption laws, including the U.S. Foreign Corrupt Practices Act (FCPA) and the U.K. Bribery Act, is critical as we operate globally including through third parties, agents, or other business partners whose misconduct could be imputed to us. While we require that they operate in compliance with our policies and procedures, there is no guarantee they will be fully effective, and violations could occur, for which we may be held responsible. Further, the interpretation and enforcement of government regulations in the U.S. has been subject to unpredictable changes. This has created additional uncertainty regarding how the FCPA will be enforced, in particular with respect to international operations, and it may also have the effect of increasing competitive pressures within our industries.
Legal compliance with import and export controls, as well as with sanctions, in the United States and other countries, is complex, and compliance restrictions and expenses could materially and adversely impact our revenue and supply chain. Many of our products are regulated by complex and changing trade controls and violations can lead to severe penalties, including fines and loss of export rights. Trade wars, sanctions and export controls imposed against Russia, China or other countries or specific parties in those countries where we do business could materially and adversely impact our business, results of operations and financial condition. Regulatory actions such as audits or investigations could result in significant penalties or restrictions on international sales. For more information, see “Risks Related to Our Business and Industry—The military conflict between Russia and Ukraine and the sanctions imposed as a result have adversely affected and may further adversely affect our business, results of operations, and financial condition.”
We and our customers and partners operate in highly regulated industries that require us and them to obtain, and comply with, federal, state, local and international government permits and approvals. We and our customers operate in a highly regulated environment requiring compliance with various domestic and international standards and certifications from agencies such as the National Voluntary Laboratory Accreditation Program and the FDA in the United States and by other governmental agencies in international markets. Our customers and partners are required to obtain and maintain various government licenses and permits for facilities or possession and use of radioactive materials. Accreditations and approvals may be denied, revoked or modified due to non-compliance or other governmental actions. Changing regulatory requirements could cause us to incur substantial costs or delays if we need to modify our products or cancel customer orders. Failure to meet new regulatory requirements could materially and adversely impact our business, results of operations and financial condition.
Failure to meeting environmental, social and governance expectations or standards could adversely affect our business, reputation, brand, results of operations and financial condition. Governments, regulators, investors, employees, customers, and other stakeholders are placing emphasis on environmental, social and governance performance of companies with varying and sometimes conflicting expectations. Global companies face increasingly complex and fragmented requirements for ESG reporting and disclosure. Compliance with these diverse and sometimes conflicting rules could be difficult and costly to implement. Our failure to successfully meet these mandates could adversely affect our business, results of operations and financial condition as they may result in operational constraints and cause us to incur expenses that may place pressure on margins or require us to increase the price of our products and services to the point that it affects demand for those products and services.
We could incur substantial costs as a result of violations of, or liabilities under, environmental laws. Our operations and properties are subject to a number of environmental, health and safety laws and regulations governing emissions, wastewater discharges, hazardous materials management and worker health and safety. Failure to comply with these standards may result in significant civil or criminal fines or penalties or enforcement actions, including regulatory or judicial orders enjoining or curtailing our operations or requiring us to conduct or fund remedial or corrective measures, install pollution control equipment or perform other actions. We have been, and may continue to be, subjected to claims of violations which could lead to costly litigation. Compliance with these and future laws and regulations may involve significant costs potentially adversely impacting our business, results of operations and financial condition.
25
Our ability to compete successfully and achieve future growth will depend on our ability to obtain, maintain, protect, defend and enforce our intellectual property and to operate without infringing, misappropriating or otherwise violating the intellectual property of others. Our intellectual property is vital to our business and insufficient protection or invalidation of these rights could significantly harm our business, results of operations and financial condition, including forcing us to, among other things, rebrand or re-design our affected products. Foreign laws may not adequately protect our intellectual property rights, increasing risks as we conduct a substantial portion of our operations and a majority of our sales outside of the United States. In addition, advances in artificial intelligence and the increasingly widespread use of such technology by us, our third parties or others, including generative artificial intelligence tools, may increase the risk of unauthorized access to, or use of, our intellectual property and unauthorized or unintended exposure of our confidential information and proprietary information, all of which could adversely affect the value of our intellectual property, including our brands, our trade secrets and our investment in research and development. Third parties have claimed and may continue to claim infringement, misappropriation or misuse of their proprietary rights, leading to costly litigation. Unsuccessful defense against such claims could result in substantial damages, halted product sales, expensive technology changes, or the need to obtain licenses to use the infringed technology or indemnify our customers. We currently have in effect, and may in the future enter into, agreements to defend, indemnify and hold harmless our customers or suppliers against damages and costs from alleged infringement, misappropriation or other violation by our products of third-party patents, trademarks or other proprietary rights. Litigation related to such obligations could be costly and divert the efforts of our technical and management personnel, regardless of the outcome. Our insurance does not cover intellectual property infringement. Any of the foregoing would materially and adversely affect our business, results of operations and financial condition.
Our use of “open source” software could negatively affect our ability to sell our products and subject us to possible litigation. A portion of our products incorporate so-called “open source” software, and future products may incorporate more. If an author or other third party that distributes such open source software were to allege that we had not complied with the conditions of one or more of these licenses, we could face costly legal disputes and significant damages, enjoined from the sale of our products that contained the open source software. Non-compliance could halt product sales and disrupt business operations. These risks could adversely affect our business, results of operations and financial condition.
Any actual or perceived failure to comply with data privacy or security laws and regulations could lead to government enforcement actions, private litigation or adverse publicity and could materially and adversely affect our business. Privacy and data security have become significant issues in many jurisdictions where we conduct business. Due to the global nature of our business, our collection, processing, distribution, and storage of personal information is subject to a variety of evolving laws and regulations. Compliance may increase our operational costs and, despite these efforts, there is a risk that we fail to comply and may become subject to government enforcement actions, fines and penalties, litigation and reputational harm. In the United States, these regulations include the Health Insurance Portability and Accountability Act of 1996 (“HIPAA”) for certain medical data in the US, as well as the California Consumer Privacy Act (“CCPA”) and California Privacy Rights Act (“CPRA”). Internationally, virtually every jurisdiction in which we operate has established its own data privacy and security legal framework with which we must comply including the comprehensive European Union General Data Protection Regulation (“GDPR”), regulations in individual countries in the EU, including France and Germany, and UK GDPR in the United Kingdom. These laws and regulations and others that may be enacted in the future, may require us to modify our data processing practices and policies, incur substantial compliance-related costs and expenses, divert resources from other initiatives and project and otherwise suffer adverse impacts on our business. Further, they may be inconsistent from one jurisdiction to another, subject to differing interpretations and may be interpreted to conflict with our practices. We cannot ensure that our compliance programs and policies will be sufficient to protect us from claims, proceedings, liability or adverse publicity. Although we endeavor to comply with our policies, we may at times fail to do so or be alleged to have failed to do so.
Additionally, we may be bound by contractual requirements applicable to our collection, use, processing and disclosure of various types of data, including personal information, and may be bound by, or voluntarily comply with, self-regulatory or other industry standards relating to these matters. Claims that we have violated individuals’ privacy rights, failed to comply with privacy and data security laws, or breached our contractual obligations, even if we are not found liable, could be expensive and time consuming to defend and could result in adverse publicity, increase our operational costs and harm our business, results of operations and financial condition.
We do not control our suppliers, customers or business partners, and their actions or omissions could harm our reputation and sales. We do not control our suppliers, customers or partners or their business practices. A violation of environmental or other laws by our suppliers, other customers or partners, or an environmental or public health incident at customer locations (e.g., release of radioactive materials) could create negative publicity and harm our reputation. Any conduct or actions that our suppliers could take could reduce demand for our products, harm our ability to meet demand or our reputation, brand image, business, results of operations and financial condition.
26
Portions of our workforce are represented by unions or works councils and are covered by collective bargaining agreements. Labor group representation has led to and may lead in the future to work stoppages that could materially and adversely affect our business. The majority of our EU employees are members of, or are represented by, works councils or trade unions and are covered by collective bargaining agreements, and a small number of our U.S. and U.K. employees are presently unionized. Non-union employees may seek such membership or representation in the future. We face risks of work stoppages and labor disturbances, including during collective bargaining renegotiations, which could adversely affect our business. Union and works council rules may limit our flexibility to respond to changing market conditions and the application of these rules could harm our business, results of operations and financial condition. Additionally, renegotiation of collective bargaining agreements may result in terms that are less favorable to us.
The elimination or any modification of the Price-Anderson Act’s financial protection and indemnification authority could have adverse consequences for our business. The Price-Anderson Act, supports the nuclear services industry by offering financial protection through nuclear liability insurance and broad indemnification for third-party public liability claims arising from a nuclear accident occurring at any commercial NPP in the United States. If this protection is reduced or removed it could lead the owners and operators of NPPs cancel or delay plans to build new plants or curtail the operations of existing plants, materially and adversely affecting our business. Although it is unlikely that the nuclear liability financial protection authority under the Price-Anderson Act would be completely abolished, some aspects of the Act could be changed during future reauthorizations and if the owners and operators of NPPs cancel or delay plans to build new plants or curtail the operations of existing plants as a result of such modifications our business could be adversely affected.
Certain of our products are subject to regulation by the FDA or international regulatory bodies as medical devices . If we are not able to obtain or maintain required approvals or registrations or if the timeline for receiving the approvals or registrations were to increase significantly due to staffing shortages we may not be able to continue to market and sell such products and it may make it more difficult for us to attract new customers, retain existing customers or maintain sales at existing levels, which could adversely affect our business. The FDA regulates virtually all aspects of a medical device design, development, testing, manufacturing, labeling, storage, record keeping, adverse event reporting, sale, promotion, distribution and shipping. Additionally, international marketing of these products requires approvals from international counterparts of the FDA, which can be a time consuming and uncertain process. We can offer no assurance that devices or their modifications will be approved or cleared by the FDA or international agencies in a timely manner or at all. Even with regulatory clearances or approvals, significant limitations on the products, indicated uses may be imposed.
Compliance with medical device reporting regulations and cGMP in the United States and ISO 13485 certification internationally is required to maintain product clearances. Advertising and promotion of our products is closely monitored by the FDA and Federal Trade Commission to prevent false or misleading claims and manufacturers must assess whether product modifications to approved products require new approvals, though the FDA can review these decisions. We cannot ensure that the FDA will agree with our decisions not to seek approvals or clearances or that new approvals will be obtained timely fashion, if at all. Additionally FDA regulations and similar international regulations necessitate product recalls for significant deficiencies or defects in design, manufacture or labeling, which can be voluntary or mandated. Recalls, whether voluntary or mandated, can result from design, manufacturing, or labeling defects, and can lead to significant expenses, negative publicity, harm to reputation and adverse effects on our business, financial condition and operating results. In these circumstances, we may also be subject to significant enforcement action. If any of these events were to occur, our ability to introduce new or enhanced products would be adversely affected, which in turn would also harm our future growth.
We are subject to federal, state, local and international regulations related to healthcare, the violation of which could result in substantial penalties and harm to our business. Our operations are governed by various laws and regulations affecting interactions with healthcare providers, particularly in sales, marketing and promotional activities. These laws limit financial arrangements with customers, potential customers, marketing consultants and other service providers, impacting how we structure offerings, like discount practices, customer support, product loans, education and training programs, physician consulting, research grants and other service arrangements. We must comply with federal and state “false claims” laws, physician self-referral laws and patient confidentiality laws such as Health Insurance Portability and Accountability Act (“HIPAA”). Non-compliance can result in legal penalties, adverse publicity, and harm our business and financial condition and impair our ability to attract new customers. The Physician Payments Sunshine Act requires annual reporting of payments to U.S. licensed physicians and teaching hospitals as well as physician ownership of such applicable manufacturer’s equity, with non-compliance resulting in monetary penalties. Similar state and foreign laws also apply, and violations could lead to civil monetary penalties and adversely impact our reputation and business, results of operations and financial condition.
27
Changes in insurance reimbursement to providers or changes in patient coverage could adversely affect our business.
Our customers rely significantly on reimbursement from public and private third-party payers for procedures utilizing our radiation oncology and other medical products. Adequate coverage and reimbursement for procedures using our products, as well as the continued health insurance coverage of patients treated with our products, are crucial for commercialization and market acceptance. Changes in reimbursement policies or a reduction in insured patients could negatively impact our revenue, customer retention and acquisition. Additionally, annual reviews by the Centers for Medicare and Medicaid Services (“CMS”), may lead to significant changes, potentially discouraging the use of our products. Reimbursement practices may also vary internationally, affecting market acceptance based on coverage and reimbursement levels in different countries.
Some of our products access data from third parties, and changes to that access may adversely impact our business.
Our SunCHECK software requires access to data such as electronic health information (“EHI”) from other third-party vendors of our customers, typically original equipment manufacturers, in order to perform quality assessments. The functioning of our analytics applications and our ability to perform analytics services is predicated on our ability to establish interfaces that download the relevant data from these third party source systems on a repeated basis and in a reliable manner. If certain market actors engage in “information blocking,” meaning activity that is likely to interfere with, prevent or materially discourage access, exchange or use of EHI, it may inhibit our ability to access the relevant data on behalf of customers and any steps we take to enforce the anti-information blocking provisions of the Cures Act could be costly, could distract management attention from the business and could materially and adversely impact our business, results of operations and financial condition.
Capital Structure Risks
The price of our Class A common stock may be volatile. The price of our Class A common stock has in the past, and may continue to fluctuate due to a variety of factors, such as changes in industry conditions, competitor developments, regulatory changes, variations in operating performance and operating results, changes in global economic and geopolitical conditions, including the imposition of sanctions and tariffs, publications by securities analysts, public reactions to our press releases, filings with the SEC, actions by stockholders, personnel changes, litigation, changes in our capital structure, such as the issuance and potential sales of 5,869,555 shares of our Class A common stock upon the redemption of 5,869,555 shares of Class B common stock of Mirion IntermediateCo, Inc. (“IntermediateCo”) together with 5,869,555 shares of our Class B common stock outstanding as of December 31, 2025, announcements by us with regard to equity or other financing or acquisitions we may make, stock repurchases, the volume of shares available for sale by significant stockholders, and other risk factors listed in this “Risk Factors” section.
Conversion of our Convertible Notes may dilute the ownership interest of our stockholders or may otherwise depress the price of our Class A common stock. Upon conversion of our Convertible Notes (as defined below), we have the option to pay or deliver, cash, shares of our Class A common stock, or a combination of both. If we elect to settle our conversion obligation in shares of our Class A common stock or a combination of cash and shares of our Class A common stock, any sales in the public market of our Class A common stock issuable upon such conversion could adversely affect prevailing market prices of our Class A common stock. In addition, the existence of our Convertible Notes may encourage short selling by market participants because the conversion of the notes could be used to satisfy short positions, or anticipated conversion of our Convertible Notes into shares of our Class A common stock could depress the price of our Class A common stock.
The conditional conversion feature of our Convertible Notes, if triggered, may adversely affect our financial condition and operating results. In the event the conditional conversion feature of our Convertible Notes is triggered, holders of such notes will be entitled to convert their notes at any time during specified periods at their option. If one or more holders elect to convert their Convertible Notes, we can elect to satisfy our conversion obligation by delivering solely shares of our Class A common stock (other than paying cash in lieu of delivering any fractional share) or we can settle a portion or all of our conversion obligation through the payment of cash. If we elected to settle a portion or all of our conversion obligations through the payment of cash, it could adversely affect our liquidity. In addition, even if holders do not elect to convert their Convertible Notes, we could be required under applicable accounting rules to reclassify all or a portion of the outstanding principal of the notes as a current rather than long-term liability, which would result in a material reduction of our net working capital.
Our indebtedness could adversely affect our financial condition. As of December 31, 2025, we had $450.0 million aggregate principal amount of indebtedness outstanding under our senior secured term loan facility (the “Term Loan Facility”) and there is additional availability under our senior secured revolving facility (the “Revolving Facility” and, together with the Term Loan Facility, the “Credit Facilities”) of up to $175.0 million. In addition, our Credit Facilities bear interest based on variable interest rates which have recently increased and may increase further from time to time in the
28
future. Continued increases in interest rates will increase the cost of servicing our outstanding indebtedness as well incurring new indebtedness and refinancing our outstanding indebtedness, and could materially and adversely affect our business, results of operations and financial condition. Our indebtedness could have important consequences to us, such as requiring us to dedicate a significant portion of our cash flows to debt payments, reducing available funds for other needs, increasing vulnerability to economic changes, limiting business flexibility, placing us at a competitive disadvantage, restricting future financing options, and exposing us to variable interest rate risks. If we fail to make scheduled payments on our debt, we risk default, which could lead to lenders terminating their commitments, demanding immediate repayment, or foreclosing on secured assets, potentially resulting in bankruptcy or liquidation.
We may incur additional debt in the future and the credit agreement governing our Credit Facilities (the “Credit Agreement”) permits us to do so subject to certain limitations. We have the ability to draw upon our $175.0 million Revolving Facility and utilize an uncommitted “accordion” feature for additional debt if certain incurrence and leverage ratio tests are satisfied. If additional debt is incurred, the related risks could increase, making it harder to meet debt obligations.
The Credit Agreement imposes restrictive covenants limiting our activities, such as incurring additional debt, merge or consolidate with other entities and creating liens. It includes a “First Lien Net Leverage Ratio” (as defined in the Credit Agreement), that could be affected by uncontrollable events, and failure to comply with any of the covenants or any other term of the Credit Agreement could cause a default. A default could accelerate of the outstanding indebtedness an cause further financial difficulties. Complying with these covenants may cause us to take actions that we otherwise would not take or not take actions that we otherwise would take.
We may continue to require additional capital to support our growth plans, and such capital may not be available on terms acceptable to us, if at all. We intend to continue making significant investments to support our business growth including acquiring businesses, personnel and technologies. Continuing to raise additional funds through issuances of equity, equity-linked or convertible debt securities, could result in significant dilution for existing stockholders, and any new equity securities could have superior rights, preferences and privileges.
We are subject to certain ownership and voting power laws and regulations which may limit the ability of stockholders to acquire our Class A common stock and therefore limit demand for our Class A common stock. Under foreign direct investment and public interest laws in various jurisdictions such as Germany, Finland, France, and the UK, certain acquisitions of our Class A common stock by investors necessitate government approval. These restrictions may limit investments and demand for shares of our Class A common stock.
Anti-takeover provisions contained in our Charter and Bylaws, as well as provisions of Delaware law, could impair or delay a takeover attempt. Our Charter and Bylaws contain provisions that may discourage takeover proposals including the board' authority to issue preferred stock without stockholder approval, no cumulative voting in director elections, the board's exclusive right to fill certain vacancies, prohibitions on stockholder action by written consent and on stockholders calling special meetings, a requirement of a two-thirds vote for certain amendments, and advance notice procedures for stockholder nominations and proposals. These measures complicate the removal of management and may discourage transactions that otherwise could involve payment of a premium over prevailing market prices for our securities.
Our Charter includes forum selection clauses, which could discourage claims or limit stockholders’ ability to make a claim against us, our directors, officers, or other employees. Our Charter generally provides that the Court of Chancery in Delaware is the exclusive forum for any stockholder (including a beneficial owner) to bring derivative actions and related claims against the Company or its directors, officers or employees and our Charter provides that the federal district courts of the United States are the exclusive forum for any complaint under the Securities Act. These clauses may discourage claims or increase costs for those seeking to bring claims.
ITEM 1B. UNRESOLVED STAFF COMMENTS
None.
29
ITEM 1C. CYBERSECURITY
Cyber Risk Management and Strategy
We have also implemented a process requiring our employees, contractors, and consultants to complete annual cybersecurity training that is designed to raise awareness of cybersecurity threats and risks through training and simulations. Our cybersecurity risk management functions include dedicated teams, tools, and processes focused on the reduction of vulnerability and exposures, risk management, and incident detection, investigation, and remediation. We also have processes to review vendor cybersecurity risk, including inspection of certain vendor certifications.
Governance
The Board has overall oversight responsibility for our risk management, and delegates its oversight of cybersecurity risk assessment and management guidelines to the Audit Committee. The Audit Committee reviews and makes recommendations to management or the Board on matters relating to cybersecurity. Management provides quarterly updates to the Audit Committee and an annual update to the Board . These discussions may include updates on threat focus, roadmaps covering planned improvements, status updates on key improvements efforts, overview information on any recent incidents or significant vulnerabilities (if any), and the status of key information security initiatives. Three of our Board members have received cybersecurity training and certification from the National Association of Corporate Directors (NACD).
ITEM 2. PROPERTIES
The Company's principal executive offices are located at 1218 Menlo Drive, Atlanta, Georgia. Our headquarters facilities consist of two buildings, which we have leased through 2031. The buildings contain approximately 31,000 square feet of floor space. The Company also leases administrative offices, as well as engineering, production and warehouse space in various locations in the United States, Canada, France, Germany, Belgium, the United Kingdom, Finland, Estonia, The Netherlands, China, Japan, and South Korea. In addition to these leased properties, we also own facilities in Belgium, France, Canada and the United States. We believe that these facilities are suitable and adequate to meet our current operating needs.
30
ITEM 3. LEGAL PROCEEDINGS
Due to the nature of our activities, we are at times subject to pending and threatened legal actions that arise out of the ordinary course of business. For information regarding legal proceedings and other claims in which we are involved, see Note 11, Commitments and Contingencies, in the notes to the financial statements included in this Annual Report on Form 10-K. The disposition of any such currently pending or threatened matters is not expected to have a material effect on our business, results of operations or financial condition. However, the results of legal actions cannot be predicted with certainty. Therefore, it is possible that our business, results of operations and financial condition could be materially adversely affected in any particular period by the unfavorable resolution of one or more legal actions. Regardless of the outcome, litigation can have an adverse impact on our business because of defense and settlement costs, diversion of management resources and other factors. In addition, the expense of litigation and the timing of this expense from period to period are difficult to estimate, subject to change and could adversely affect our consolidated financial statements.
ITEM 4. MINE SAFETY DISCLOSURES
Not applicable.
31
PART II - OTHER INFORMATION
ITEM 5. MARKET FOR REGISTRANT’S COMMON EQUITY, RELATED STOCKHOLDER MATTERS AND ISSUER PURCHASES OF EQUITY SECURITIES
Market Information
Our Class A common stock is listed on the NYSE under the symbol “MIR”.
Holders
As of February 12, 2026, the company had 244,667,792 shares of Class A common stock outstanding and held by 9 holders, and 5,864,555 shares of Class B common stock outstanding and held by approximately 14 holders. Such amounts do not include DTC participants, beneficial owners holding shares through nominee names, or shares held in treasury by Mirion.
Dividends
We have not paid any cash dividends on common stock to date. Our ability to pay dividends is limited by restrictions on our ability to pay dividends or make distributions under the terms of the Credit Facilities. Any future determination to declare dividends will be made at the discretion of our board of directors, subject to applicable laws, and will depend on a number of factors, including our financial condition, results of operations, capital requirements, contractual restrictions, general business conditions and other factors that our board of directors may deem relevant.
Performance Graph
The graph below compares the cumulative total return for our shares of Class A common stock from August 20, 2020 through December 31, 2025 with the comparable cumulative return of four indices: the S&P 500 Index (“S&P 500”), Nasdaq, the Dow Jones Technologies Average Index (“DJIA”), and the Russell 2000. The graph assumes $100 invested on August 20, 2020 in each of our Class A common stock and the three indices presented. The stock price performance included in the below graph is not necessarily indicative of future stock performance. On October 20, 2021, the business combination with GS Acquisition Holdings Corp II (“GSAH”) was consummated and GSAH was renamed Mirion Technologies, Inc. and, pursuant to the terms of the Business Combination Agreement, Mirion TopCo combined with a subsidiary of GSAH. The graph below represents GSAH until October 20, 2021 and MIR from October 20, 2021 to December 31, 2025.
32
This performance graph shall not be deemed “soliciting material” or to be “filed” with the SEC for purposes of Section 18 of the Exchange Act, or otherwise subject to the liabilities under that Section, and shall not be deemed to be incorporated by reference into any our filings under the Securities Act or the Exchange Act.
Recent Sales of Unregistered Securities; Use of Proceeds from Registered Offerings
a.Sale of Unregistered Equity Securities
None.
b. Use of Proceeds from Public Offering of Common Stock
On September 30, 2025, the Company completed a Public Offering of 19,906,322 shares of the Company’s Class A common stock at a public offering price of $21.35 per share (“September 2025 Class A Common Stock Offering”). The gross proceeds from the September 2025 Class A Common Stock Offering were approximately $425.0 million, net of $15.3 million of offering costs, underwriting discounts and commissions, legal and other expenses for net proceeds from the offering of $409.7 million. The September 2025 Class A Common Stock Offering was made pursuant to the Company’s shelf registration statement on Form S-3 (File No. 333-268445) previously filed with the SEC, which was declared effective on November 28, 2022 under the Securities Act, including the related prospectus dated November 28, 2022, as supplemented by a preliminary prospectus supplement, dated September 24, 2025, and prospectus supplement, dated September 25, 2025, filed with the SEC pursuant to Rule 424(b) under the Securities Act.
The net proceeds from the September 2025 Class A Common Stock Offering, together with the net proceeds from a convertible notes offering, were used to (i) pay the approximately $38.0 million cost of the capped call transactions entered into in conjunction with the referenced convertible notes offering, (ii) fund the $588.4 million of gross purchase consideration ($581.3 million, net of cash and net working capital adjustment) acquisition cost of all of the outstanding membership interests of WCI-Gigawatt Intermediate Holdco, LLC, as the indirect parent of Paragon Energy Solutions, LLC that was completed on December 1, 2025 and (iii) for general corporate purposes.
Issuer Purchases of Equity Securities
On December 3, 2024, the Company instituted a share repurchase program for up to $100.0 million of then-outstanding shares of its Class A common stock, as approved by the Board of Directors of the Company, which expires on November 14, 2029, and can be terminated at any time by the Company without any notice. Under the share repurchase program, the Company intends to repurchase shares from time to time through open market purchases, privately negotiated transactions, block purchases and otherwise in accordance with applicable federal securities laws, including Rules 10b5-1 and 10b-18 of the Exchange Act. During the three months ended December 31, 2025, there were no repurchases of the Company’s Class A common stock under this program.
ITEM 6. [RESERVED]
33
ITEM 7. MANAGEMENT’S DISCUSSION AND ANALYSIS OF FINANCIAL CONDITION AND RESULTS OF OPERATIONS
You should read the following discussion and analysis of Mirion’s financial condition and results of operations together with the consolidated financial statements and related notes of Mirion Technologies, Inc. that are included elsewhere in this Annual Report on Form 10-K. This discussion contains forward-looking statements based upon current expectations that involve risks and uncertainties. Our actual results may differ materially from those anticipated in these forward-looking statements as a result of various factors, including those set forth under the section entitled “Part I, Item 1A. Risk Factors” or in other parts of this Annual Report on Form 10-K. Please also see the section entitled “Cautionary Note Regarding Forward-Looking Statements.” Unless the context otherwise requires, references in this section to “we,” “us,” “our,” “Mirion” and “the Company” refer to the business and operations of Mirion and its consolidated subsidiaries. Unless the context otherwise requires or unless otherwise specified, all dollar amounts in this section are in millions.
Overview
We are a global provider of products, services, and software that allow our customers to safely leverage the power of ionizing radiation for the greater good of humanity through critical applications in the nuclear, medical and defense markets, as well as laboratories, scientific research, analysis, and space exploration.
Nuclear power plant product offerings are used for the full nuclear power plant lifecycle including core detectors, essential measurement devices and security systems for new build, maintenance, decontamination and decommission, and equipment for monitoring and control during fuel dismantling and remote environmental monitoring. We provide dosimetry solutions for monitoring the total amount of radiation medical staff members are exposed to over time, radiation therapy quality assurance solutions for calibrating and verifying imaging and treatment accuracy, and radionuclide therapy products for nuclear medicine applications such as product handling, medical imaging furniture, and rehabilitation products. We provide robust, field-ready personal radiation detection and identification equipment for defense applications and radiation detection and analysis tools for power plants, labs, and research applications.
We manage and report results of operations in two business segments: Nuclear & Safety and Medical.
•Our revenues were $925.4 million for the year ended December 31, 2025, of which 66.4% and 33.6% were generated in the Nuclear & Safety segment and the Medical segment, respectively. Revenues were $860.8 million for the year ended December 31, 2024, of which 65.2% and 34.8% were generated in the Nuclear & Safety and the Medical segment, respectively. Revenues were $800.9 million for the year ended December 31, 2023, of which 64.5% and 35.5% were generated in the Nuclear & Safety segment and the Medical segment, respectively.
•Remaining performance obligations (representing committed but undelivered contracts and purchase orders) were $1,104.3 million and $811.9 million as of December 31, 2025, and December 31, 2024, respectively.
Key Factors Affecting Our Performance
We believe that our business and results of operations and financial condition may be impacted in the future by various trends, conditions and risks. The Board has overall oversight responsibility for our risk management. During 2024, the Company initiated a formal Enterprise Risk Management program ("ERM") where management and Internal Audit provide updates to the Board. These discussions include identification and scoring of key business risks and management’s plans and progress to address identified focus areas.
The following key factors affecting our performance have included, and we anticipate they will continue to affect our future results:
•Nuclear power end market trends—Growth and operating results in our Nuclear & Safety segment are impacted by:
•Our products are installed at the vast majority of addressable active nuclear power reactors globally, creating full lifecycle sales opportunities. This installed base drives recurring revenue through replacement and service cycles associated with our offerings and the typical 40 to 100 year operating life cycle of an NPP;
•The emerging megatrends surrounding the power demands of data centers, cloud computing, and artificial intelligence that can be served by Nuclear;
•Increased government and industry acceptance of Nuclear as a) a clean energy source, and b) a viable option for domestic energy production in efforts to rely less on international imports; and
34
•Decisions by governments to build new power plants or decommission existing plants can positively and negatively impact our customer base.
•Medical end market trends—Growth and operating results in our Medical segment are impacted by:
•Medical radiation therapy quality assurance (“RT QA”) growth driven by growing and aging population demographics, low penetration of RT QA technology in emerging markets, and increased adoption of advanced software and hardware solutions for improved outcomes and administrative and labor efficiencies;
•Changes to global regulatory standards, including new or expanded standards;
•Increased focus on healthcare safety;
•Medical/lab dosimetry growth supported by growing and aging demographics, increased number of healthcare professionals, and penetration of radiation therapy/diagnostics;
•Changes to healthcare reimbursement; and
•Potential budget constraints in hospitals and other healthcare providers.
•Nuclear new build projects—A portion of our remaining performance obligations is driven by contracts associated with the construction of new nuclear power plants. These contracts can be long-term in nature and provide us with a strong pipeline for the recognition of future revenues in our Nuclear & Safety segment. We perform our services and provide our products at a fixed price for certain contracts. Fixed-price contracts carry inherent risks, including risks of losses from underestimating costs, operational difficulties and other changes that may occur over the contract period. If our cost estimates for a contract are inaccurate or if we do not execute the contract within our cost estimates, we may incur losses or the contract may not be as profitable as we expected. In addition, even though some of our longer-term contracts contain price escalation provisions, such provisions may not fully provide for cost increases, whether from inflation, the cost of goods and services to be delivered under such contracts or otherwise.
•Geopolitical and Trade Conditions—Geopolitical and trade conditions, including related to matters affecting Russia, the relationships between the United States and China, and conflict in the Middle East and risks related to tariffs and global trade relations, export controls and other trade barriers have impacted and may continue to impact us, through increased inflation, limited availability of certain commodities, supply chain disruption, disruptions to our global technology infrastructure. including cyberattacks, increased terrorist activities, volatility or disruption in the capital markets, and delays or cancellations of customer projects.
•Inflation and Interest Rates—We continue to actively monitor, evaluate and respond to developments relating to operational challenges in the current inflationary environment. Global supply chain disruptions and the higher inflationary environment remain unpredictable and our past results may not be indicative of future performance. In addition, the increase in interest rates has in turn led to increases in the interest rates applicable to our indebtedness and increased our debt service costs.
•Sanctions—There are, at any given time, a multitude of ongoing or threatened armed conflicts around the world. As one example, sanctions by the United States, the European Union, and other countries against Russian entities or individuals related to the Russia-Ukraine conflict, along with any Russian retaliatory measures could increase our costs, adversely affect out operations, or impact our ability to meet existing contractual obligations.
•Strategic transactions—A large driver of our historical growth has been the acquisition and integration of related businesses. Our ability to integrate, restructure, and leverage synergies of these businesses will impact our operating results over time. From time to time we also divest businesses which could also impact our operating results.
•Environmental objectives of governments—Growth and operating results in our Nuclear & Safety segment are impacted by environmental policy decisions made by governments in the countries where we operate. Our nuclear power customers may benefit from decarbonization efforts given the relatively low carbon footprint of nuclear power to other existing energy sources.
•Government budgets—While we believe that we are poised for growth from governmental customers in both of our segments, our revenues and cash flows from government customers are influenced, particularly in the short-term, by budgetary cycles. This impact can be either positive or negative.
•Research and development—A portion of our operating expenses is associated with research and development activities associated with the design of new products. Given the specific design and application of these products, there is some risk that these costs will not result in successful products in the market. Further, the timing of these products can move and be challenging to predict.
•Financial risks—Our business and financial statements can be adversely affected by foreign currency exchange rates, changes in interest rates, recognition of impairment charges for our goodwill or other intangible assets and fluctuations in the cost and availability of commodities.
35
•Global risk, including tariffs—Our business depends in part on operations and sales outside the United States. Risks related to those international operations and sales include new foreign investment laws, new export/import regulations, global trade relations and additional trade restrictions (such as tariffs, sanctions, and embargoes). New laws that favor local competitors could prevent our ability to compete outside the United States. Additional potential issues are associated with the impact of these same risks on our suppliers and customers. If our customers or suppliers are impacted by these risk factors, we may see the reduction or cancellation of customer orders, or interruptions in raw materials and components.
•Tax risks—Our business and financial statements can be adversely affected by changes in tax rates or exposure to tax liabilities/assessments:
•Our effective tax rate could be impacted by changes in tax laws;
•Audits or assessments by tax authorities could result in additional tax payments for prior periods;
•Foreign remittance taxes have not been provided on undistributed earnings of certain of our non-US subsidiaries to the extent such earnings are considered to be indefinitely reinvested in operations. Changes in our intentions regarding reinvestment of such earnings could impact our income tax provision, cash taxes paid and effective tax rate; and
•The OECD (Organization for Economic Co-operation and Development) has proposed a global minimum tax of 15% of reported profits (Pillar Two) and many countries have incorporated Pillar Two model rule concepts into their domestic laws. Pillar Two legislation is effective for the Company for the year ended December 31, 2025. Although the model rules provide a framework for applying the minimum tax, countries may enact Pillar Two slightly differently than the model rules and on different timelines. While we expect the impact to be immaterial, Pillar Two could impact our cash taxes paid and effective tax rate.
Non-GAAP Financial Measures
We report our financial results in accordance with generally accepted accounting principles in the United States. (“GAAP”). However, management believes certain non-GAAP financial measures provide investors and other users with additional meaningful information that should be considered when assessing our ongoing performance. Management also uses these non-GAAP financial measures in making financial, operating, and planning decisions, and in evaluating our performance. Non-GAAP financial measures should be viewed in addition to, and not as an alternative for, our GAAP results. The non-GAAP financial measures we present may differ from similarly captioned measures presented by other companies. Investors are encouraged to review the related GAAP financial measures and the reconciliation of these non-GAAP financial measures to their most directly comparable GAAP financial measures, and not to rely on any single financial measure to evaluate our business.
We use the non-GAAP financial measures “EBITA,” “EBITDA,” and “Adjusted EBITDA.” “Adjusted EBITDA" is used in the calculation of the First Lien Net Leverage Ratio in the 2021 Credit Agreement described in Note 8, Borrowings. See the “Results of Operations” sections below for definitions of our non-GAAP financial measures and reconciliation to their most directly comparable GAAP measures. Tax impacts for the non-GAAP financial measures are calculated based on the appropriate tax rate for each individual item presented.
36
The following table presents a reconciliation of certain non-GAAP financial measures for the years ended December 31, 2025, December 31, 2024, and December 31, 2023.
| (In millions) | Year Ended December 31, 2025 | Year Ended December 31, 2024 | Year Ended December 31, 2023 | ||||||||||||||
| Net income (loss) | $ | 29.8 | $ | (36.6) | $ | (98.7) | |||||||||||
| Interest expense, net | 30.1 | 51.3 | 57.1 | ||||||||||||||
| Income tax expense (benefit) | 2.9 | 2.7 | (6.6) | ||||||||||||||
| Amortization | 102.4 | 118.5 | 131.3 | ||||||||||||||
| EBITA | $ | 165.2 | $ | 135.9 | $ | 83.1 | |||||||||||
| Depreciation | 35.6 | 31.9 | 31.5 | ||||||||||||||
| EBITDA | $ | 200.8 | $ | 167.8 | $ | 114.6 | |||||||||||
| Stock-based compensation expense | 15.2 | 15.6 | 21.9 | ||||||||||||||
| Increase in fair value of warrant liabilities | — | 5.3 | 24.8 | ||||||||||||||
| Loss on debt extinguishment and other related costs | 6.3 | — | 2.6 | ||||||||||||||
| Foreign currency (gain) loss, net | (17.4) | 2.2 | (0.3) | ||||||||||||||
Non-operating expenses(1)(2)(3)(4) | 23.0 | 12.7 | 17.1 | ||||||||||||||
| Adjusted EBITDA | $ | 227.9 | $ | 203.6 | $ | 180.7 | |||||||||||
(1)Non-operating expenses relate to costs that are nonrecurring in nature in our operations and are further described below.
(2)Pre-tax non-operating expenses of $23.0 million for the year ended December 31, 2025, include $15.7 million of mergers and acquisitions costs associated with our acquisitions of Paragon and Certrec; $2.9 million of restructuring and other related costs; $1.9 million of consulting costs related to Nuclear & Safety segment enterprise resource planning implementations which were substantially completed as of December 31, 2025; $1.3 million of one-time consulting fees related to IT services sourcing excellence; and a $1.0 million asset impairment of an equity investment (100% impairment).
(3)Pre-tax non-operating expenses of $12.7 million for the year ended December 31, 2024, include $5.5 million of restructuring related costs primarily from the closure of our Middleton, WI facility, $4.1 million in costs for one time set-up and integration for operational initiatives of which $3.6 million related to one-time set-up fees of our global procurement office, $2.4 million of information technology system set-up costs for our Radiation Therapy and Nuclear Medicine divisions which was substantially completed as of December 31, 2024, and $1.9 million related to mergers and acquisition expenses of which $1.4 million was for a one-time employee retention. Offsetting these items was a $1.2 million gain on the disposals of Rehab business.
(4)Pre-tax non-operating expenses of $17.1 million for the year ended December 31, 2023, include a $5.9 million loss on disposal of Rehab business, net of gain on lease termination, $4.2 million related to mergers and acquisition expenses, $1.8 million of information technology system set-up costs to support public company requirements, $1.7 million in costs for one time set-up and integration for operational initiatives, $1.6 million of restructuring costs, $1.0 million secondary offering fees incurred pursuant to our registration rights agreement in connection with offerings by one of our former investors, and $0.8 million related to incremental one-time costs associated with becoming a public company.
37
The following tables present reconciliations of non-GAAP Adjusted EBITDA by segment for the years ended December 31, 2025, December 31, 2024, and December 31, 2023.
| Year Ended December 31, 2025 | |||||||||||||||||||||||
| (In millions) | Nuclear & Safety | Medical | Corporate & Other | Consolidated | |||||||||||||||||||
| Income (loss) from operations | $ | 101.1 | $ | 46.9 | $ | (96.5) | $ | 51.5 | |||||||||||||||
| Amortization | 57.1 | 45.3 | — | 102.4 | |||||||||||||||||||
| Depreciation | 14.5 | 20.2 | 0.9 | 35.6 | |||||||||||||||||||
| Stock-based compensation | 2.4 | 1.8 | 11.0 | 15.2 | |||||||||||||||||||
| Non-operating expenses | 2.1 | 3.1 | 18.3 | 23.5 | |||||||||||||||||||
| Other income / expense | 0.5 | (1.0) | 0.2 | (0.3) | |||||||||||||||||||
| Adjusted EBITDA | $ | 177.7 | $ | 116.3 | $ | (66.1) | $ | 227.9 | |||||||||||||||
| Year Ended December 31, 2024 | |||||||||||||||||||||||
| (In millions) | Nuclear & Safety | Medical | Corporate & Other | Consolidated | |||||||||||||||||||
| Income (loss) from operations | $ | 78.9 | $ | 22.3 | $ | (76.4) | $ | 24.8 | |||||||||||||||
| Amortization | 65.9 | 52.6 | — | 118.5 | |||||||||||||||||||
| Depreciation | 10.9 | 20.4 | 0.6 | 31.9 | |||||||||||||||||||
| Stock-based compensation | 1.8 | 1.1 | 12.7 | 15.6 | |||||||||||||||||||
| Non-operating expenses | 2.1 | 8.0 | 2.2 | 12.3 | |||||||||||||||||||
| Other income / expense | 0.2 | 0.2 | 0.1 | 0.5 | |||||||||||||||||||
| Adjusted EBITDA | $ | 159.8 | $ | 104.6 | $ | (60.8) | $ | 203.6 | |||||||||||||||
| Year Ended December 31, 2023 | |||||||||||||||||||||||
| (In millions) | Nuclear & Safety | Medical | Corporate & Other | Consolidated | |||||||||||||||||||
| Income (loss) from operations | $ | 46.0 | $ | 13.0 | $ | (80.9) | $ | (21.9) | |||||||||||||||
| Amortization | 76.6 | 54.7 | — | 131.3 | |||||||||||||||||||
| Depreciation | 10.3 | 20.5 | 0.7 | 31.5 | |||||||||||||||||||
| Stock-based compensation | 1.3 | 0.7 | 19.9 | 21.9 | |||||||||||||||||||
| Non-operating expenses | 1.1 | 8.6 | 8.5 | 18.2 | |||||||||||||||||||
| Other income / expense | 0.1 | — | (0.4) | (0.3) | |||||||||||||||||||
| Adjusted EBITDA | $ | 135.4 | $ | 97.5 | $ | (52.2) | $ | 180.7 | |||||||||||||||
Our Business Segments
We manage and report our business in two business segments: Nuclear & Safety and Medical.
Nuclear & Safety includes products and services focused on addressing critical radiation safety, measurement and analysis applications across nuclear energy, laboratories and research and other industrial markets such as defense. For Nuclear Power Plants (“NPPs”), we sell products and services for use at any stage of their life (construction, operation, decommissioning and dismantling), with NPPs representing the majority of our sales into the nuclear end market.
Medical includes products and services for radiation therapy, nuclear medicine and personal dosimetry. This segment’s principal product offering is in Radiation Therapy Quality Assurance, which includes solutions for calibrating and/or verifying imaging, treatment machine, patient treatment plan, and patient treatment accuracy. The advancing field of Nuclear Medicine is also served by this market including products for radiation measurement, product handling, and medical imaging, inclusive of software across the radiopharmaceutical lifecycle. Dosimetry solutions monitoring the total amount of radiation medical staff members are exposed to over time.
38
Recent Developments in 2025
May 2025 Convertible Notes Offering
On May 23, 2025, the Company completed a private offering of $400.0 million aggregate principal amount of 0.25% Convertible Senior Notes due 2030 (the “2030 Notes”), which included the initial purchasers' exercise in full of their option to purchase additional 2030 Notes. The Notes have a maturity date of June 1, 2030. Refer to discussion included within Liquidity and Capital Resources for more details.
June 2025 Term Loan Refinancing
The Company's 2021 Credit Agreement provides for an $830.0 million senior secure first lien term loan facility (initially scheduled to mature in October 2028). On June 5, 2025, the Company utilized funds from the offering of the 2030 Notes completed on May 23, 2025 to repay $244.6 million in outstanding principal and $8.3 million in accrued interest as well as extend the maturity date of the term loan to June 5, 2032. There were no other changes to the terms of the Credit Facilities as a result of the refinancing. The change was accounted for prospectively as a partial debt extinguishment in accordance with ASC 470-50, Debt - Modifications and Extinguishments. Refer to discussion included within Liquidity and Capital Resources for more details.
Certrec Acquisition
On July 31, 2025, Mirion acquired 100% of the equity interest of Certrec for $82.9 million of purchase consideration ($80.6 million net of cash), subject to final closing statement balances. As part of the Nuclear & Safety segment, Certrec is a leading supplier of regulatory compliance and digital integration solutions for the energy industry. Mirion management believes the Certrec business will be pivotal in expanding our offerings in the nuclear power market and further strengthen the development of our digital ecosystem.
September 2025 Class A Common Stock Offering, September 2025 Convertible Notes Offering, and Agreement to Purchase Paragon Energy Solutions
On September 30, 2025, the Company completed a public offering of 19,906,322 shares of Mirion's Class A common stock at a public offering price of $21.35 per share, including the underwriters' exercise in full of their option to purchase additional shares. Additionally, on September 30, 2025, the Company completed a private offering of $375.0 million in aggregate principal amount of 0.00% Convertible Senior Notes due 2031, including the initial purchasers’ exercise in full of their option to purchase additional Notes (the “2031 Notes” and, together with the 2030 Notes, the “Convertible Notes). The Notes have a maturity date of October 1, 2031. The Company used the net proceeds from the Class A common stock offering, together with the net proceeds from the offering of 2031 Notes, to fund the acquisition of all of the outstanding membership interests of WCI-Gigawatt Intermediate Holdco, LLC, as the indirect parent of Paragon Energy Solutions, LLC, for approximately $585.0 million pursuant to the equity purchase agreement signed September 24, 2025. Remaining funds from the offerings will be used for general corporate purposes and working capital. Refer to discussion included within Liquidity and Capital Resources for more details.
Paragon Acquisition
On December 1, 2025, Mirion acquired 100% of the outstanding membership interest of WCI-Gigawatt Intermediate Holdco, LLC, the indirect parent of Paragon Energy Solutions, LLC (“Paragon”) for $588.4 million of gross purchase consideration ($581.3 million, net of cash and net working capital adjustment), subject to final closing statement balances. As part of the Nuclear & Safety segment, Paragon is a leading provider of highly engineered solutions for large-scale nuclear power plants and small modular reactors (SMRs) in the United States. Mirion management believes that Paragon will provide Mirion's nuclear power customers with a more comprehensive suite of product offerings and services to meet their growing needs. Additionally, the addition of Paragon significantly enhances our presence in the U.S. nuclear power market and the developing SMR commercial entrants.
Russia and Ukraine
The United States, the European Union, the United Kingdom and other governments have implemented major trade and financial sanctions against Russia and related parties in response to Russia's invasion of Ukraine. We do business with Russian customers both within and outside of Russia and with customers who have contracts with Russian counterparties. The conflict’s impact on the Company is predominantly in our Nuclear & Safety segment. As of December 31, 2025, the Company has approximately $15.8 million in net contract assets and accounts receivable for Russian customers and channel partners. The Company maintains $3.2 million in advance payment guarantees and $9.8 million in performance guarantees in support of these projects. The remaining performance obligations in our backlog for Russian-related projects
39
were approximately $103.2 million at December 31, 2025. While we have not experienced significant impacts to our business results from these sanctions, the Company will continue to monitor the social, political, regulatory and economic environment in Ukraine and Russia, and will consider actions as appropriate.
Basis of Presentation
Financial information presented was derived from our historical consolidated financial statements and accounting records, and they reflect the historical financial position, results of operations and cash flows of the business in conformity with U.S. GAAP for financial statements and pursuant to the accounting and disclosure rules and regulations of the SEC. The consolidated financial statements include the accounts of the Company and its wholly owned and majority-owned or controlled subsidiaries. For consolidated subsidiaries where our ownership is less than 100%, the portion of the net income or loss allocable to noncontrolling interests is reported as “Income (loss) attributable to noncontrolling interests” in the consolidated statements of operations. All intercompany accounts and transactions have been eliminated in consolidation.
Results of Operations
Year ended December 31, 2025 compared to year ended December 31, 2024
| (Dollars in millions) | Year Ended December 31, 2025 | Year Ended December 31, 2024 | $ Change | % Change | |||||||||||||||||||
| Revenues | $ | 925.4 | $ | 860.8 | $ | 64.6 | 7.5 | % | |||||||||||||||
| Cost of revenues | 486.8 | 461.1 | 25.7 | 5.6 | % | ||||||||||||||||||
| Gross profit | 438.6 | 399.7 | 38.9 | 9.7 | % | ||||||||||||||||||
| Selling, general and administrative expenses | 348.2 | 341.1 | 7.1 | 2.1 | % | ||||||||||||||||||
| Research and development | 38.9 | 35.0 | 3.9 | 11.1 | % | ||||||||||||||||||
| Gain on disposal of business | — | (1.2) | 1.2 | (100.0) | % | ||||||||||||||||||
| Income from operations | 51.5 | 24.8 | 26.7 | 107.7 | % | ||||||||||||||||||
| Interest expense, net | 30.1 | 51.3 | (21.2) | (41.3) | % | ||||||||||||||||||
| Loss on debt extinguishment | 5.8 | — | 5.8 | 100.0 | % | ||||||||||||||||||
| Foreign currency (gain) loss, net | (17.4) | 2.2 | (19.6) | (890.9) | % | ||||||||||||||||||
| Increase in fair value of warrant liabilities | — | 5.3 | (5.3) | (100.0) | % | ||||||||||||||||||
| Other expense (income), net | 0.3 | (0.1) | 0.4 | (400.0) | % | ||||||||||||||||||
| Income (loss) before income taxes | 32.7 | (33.9) | 66.6 | (196.5) | % | ||||||||||||||||||
| Income tax expense | 2.9 | 2.7 | 0.2 | 7.4 | % | ||||||||||||||||||
| Net income (loss) | 29.8 | (36.6) | 66.4 | (181.4) | % | ||||||||||||||||||
| Income (loss) attributable to noncontrolling interests | 1.0 | (0.5) | 1.5 | (300.0) | % | ||||||||||||||||||
| Net income (loss) attributable to stockholders | $ | 28.8 | $ | (36.1) | $ | 64.9 | (179.8) | % | |||||||||||||||
Overview
Revenues for the year ended December 31, 2025 were $925.4 million, an increase of $64.6 million, or 7.5%, from the prior year. Our Nuclear & Safety segment contributed $614.6 million and $561.1 million of revenues for the years ended December 31, 2025 and 2024, respectively. Our Medical segment contributed $310.8 million and $299.7 million of revenues for the years ended December 31, 2025 and 2024, respectively. Gross profit was $438.6 million and $399.7 million for the years ended December 31, 2025 and 2024, respectively, resulting in a $38.9 million increase from the prior year.
Net income (loss) was $29.8 million and $(36.6) million for the year ended December 31, 2025 and 2024, respectively. Our Nuclear & Safety segment was responsible for $101.1 million income from operations and $78.9 million income from operations for the years ended December 31, 2025 and 2024, respectively. Our Medical segment contributed $46.9 million income from operations and $22.3 million income from operations for the years ended December 31, 2025 and 2024, respectively. The overall increase in net income is primarily driven by increased revenues in both Nuclear & Safety and Medical segments, decreased interest expense, a $17.4 million unrealized foreign currency gain as a result of fluctuations in
40
the exchange rate between the US Dollar and the Euro in the current period, decreased amortization of intangible assets, and a $5.3 million decrease in the loss from fair value of warrant liabilities in the prior year that no longer impacts the current year. Partially offsetting these items were increased mergers and acquisition expenses, increased compensation costs in the current year, a $5.8 million loss on debt extinguishment in the current period, and increased depreciation expense.
Revenues
Revenues were $925.4 million for the year ended December 31, 2025 and $860.8 million for the year ended December 31, 2024, which represents a $64.6 million increase period over period.
Nuclear & Safety segment revenues increased $53.5 million for the year ended December 31, 2025 compared with the year ended December 31, 2024 primarily due to current period acquisitions, foreign exchange fluctuations, organic volume growth, and price increases.
Medical segment revenues increased $11.1 million for the year ended December 31, 2025 compared with the year ended December 31, 2024 primarily due to price increases, recovery from operational delays in the comparable prior period, foreign exchange fluctuations, and organic volume growth.
Cost of revenues
Cost of revenues was $486.8 million for the year ended December 31, 2025 and $461.1 million for the year ended December 31, 2024, which represents a $25.7 million increase period over period.
Cost of revenues related to the Nuclear & Safety segment increased $28.5 million period over period. The increase was primarily driven by increased costs of material and labor of $7.4 million, foreign exchange impacts of $7.3 million, costs related to current period acquisitions of $6.2 million, domestic volume growth of $4.7 million, and increased depreciation of $2.9 million.
Cost of revenues related to the Medical segment decreased $2.8 million period over period primarily due to favorable margins as a result of product mix in the current period, partially offset by inflationary impacts.
Selling, general and administrative expenses
Selling, general and administrative (“SG&A”) expenses were $348.2 million for the year ended December 31, 2025 and $341.1 million for the year ended December 31, 2024, resulting in an increase of $7.1 million.
Our Nuclear & Safety segment incurred higher SG&A expenses of $0.5 million for the year ended December 31, 2025 compared to the previous period. The increase was primarily driven by current period costs associated with mergers and acquisition as well as higher compensation costs in the current year, partially offset by decreased amortization expense resulting from fully amortized intangible assets.
Our Medical segment incurred lower SG&A expenses of $10.7 million for the year ended December 31, 2025 compared to the previous period. The decrease was primarily driven by lower amortization expense related to intangible assets.
Corporate SG&A expenses were $88.1 million for the year ended December 31, 2025 and $70.8 million for the year ended December 31, 2024. The higher SG&A expenses of $17.3 million were driven by current period expenses associated with mergers and acquisitions and increased compensation costs, partially offset by decreased stock-based compensation expense and general corporate spend.
Research and development
Research and development (“R&D”) expenses were $38.9 million for the year ended December 31, 2025 and $35.0 million for the year ended December 31, 2024, resulting in an increase of $3.9 million. The increase in R&D expense was primarily due to increased compensation costs and deprecation expense for the year ended December 31, 2025 as compared to the year ended December 31, 2024.
41
Income from operations
Income from operations was $51.5 million and $24.8 million for the year ended December 31, 2025 and 2024, respectively, representing an increase of $26.7 million. On a segment basis, income from operations in the Nuclear & Safety segment was $101.1 million and $78.9 million for the year ended December 31, 2025 and 2024, respectively, representing an increase of $22.2 million. Income from operations in the Medical segment was $46.9 million and $22.3 million for the year ended December 31, 2025 and 2024, respectively, representing an increase of $24.6 million. Corporate expenses were $96.5 million and $76.4 million for the year ended December 31, 2025 and 2024, respectively, representing an increase in loss from operations of $20.1 million. See “Business segments” and “Corporate and other” below for further details.
Interest expense, net
Interest expense, net, was $30.1 million for the year ended December 31, 2025 and $51.3 million for the year ended December 31, 2024. The decrease in interest expense was attributable to decreased interest rates from the prior period, the $244.6 million decrease in the term loan balance as a result of the debt refinancing during the year ended December 31, 2025, the 0.25% interest rate negotiated on the $400.0 million offering of Convertible Senior Notes due 2030 completed during the year ended December 31, 2025, and additional interest earned on cash deposits in the current period. For more information, see Note 8, Borrowings, Note 9, Convertible Debt, and Note 19, Derivatives and Hedging, to the Consolidated Financial Statements included elsewhere in this Annual Report on Form 10-K.
Foreign currency loss (gain), net
We recorded a gain of $17.4 million for the year ended December 31, 2025 and a loss of $2.2 million for the year ended December 31, 2024 from foreign currency exchange. The change in net foreign currency loss (gain) is due primarily to fluctuations in European local currencies in relation to the U.S. dollar and the related impact on our intercompany loans.
Loss on debt extinguishment
Loss on debt extinguishment was $5.8 million for the year ended December 31, 2025, related to the refinancing of the term loan completed on June 5, 2025. See discussion in "Recent Developments - Term Loan Refinancing" for further details.
Change in fair value of warrant liabilities
We recognized a loss of $5.3 million for the year ended December 31, 2024. During the year ended December 31, 2024, we settled the Public Warrant and Private Placement Warrant liabilities in conjunction with the Public Warrant redemption and the Private Placement Warrant exchange. See Note 1, Nature of Business and Summary of Significant Accounting Policies, and Note 17, Fair Value Measurements, to the Consolidated Financial Statements included elsewhere in this Annual Report on Form 10-K.
Income taxes
The effective income tax rate was 8.9% and (7.9)% for the year ended December 31, 2025 and December 31, 2024, respectively. The difference in effective tax rate between the periods was primarily attributable to mix of earnings and valuation allowances.
The effective income tax rate differs from the U.S. statutory rate of 21% due primarily to U.S. federal permanent differences and the impact of valuation allowances.
Business segments
The following provides detail for business segment results for the year ended December 31, 2025 and 2024. Segment income from operations includes revenues of the segment less expenses that are directly related to those revenues but excludes certain charges to cost of revenues and SG&A expenses predominantly related to corporate costs, which are included in Corporate and Other in the table below. Interest expense, loss on debt extinguishment, foreign currency loss (gain), net, and other income, net, are not allocated to segments.
For reconciliations of segment revenues and operating income to our consolidated results, see Note 17, Segment Information, to the Consolidated Financial Statements included elsewhere in this Annual Report on Form 10-K.
42
Nuclear & Safety
| (Dollars in millions) | December 31, 2025 | December 31, 2024 | $ Change | % Change | |||||||||||||||||||
| Revenues | $ | 614.6 | $ | 561.1 | $ | 53.5 | 9.5 | % | |||||||||||||||
| Income from operations | $ | 101.1 | $ | 78.9 | $ | 22.2 | 28.1 | % | |||||||||||||||
| Income from operations as a % of revenues | 16.4 | % | 14.1 | % | |||||||||||||||||||
Nuclear & Safety segment revenues were $614.6 million for year ended December 31, 2025 and $561.1 million for the year ended December 31, 2024, representing an increase of $53.5 million. The increase is primarily driven by $15.1 million in revenue from current year acquisitions, positive foreign exchange fluctuations of $13.9 million, $13.3 million in organic volume growth primarily from the Nuclear Power end market, and $11.2 million of price increases.
Income from operations was $101.1 million for the year ended December 31, 2025 and $78.9 million for the year ended December 31, 2024. Income from operations increased $22.2 million period over period driven primarily by the changes in revenues described above and $11.7 million in lower amortization expenses due to fully amortized intangible assets. Partially offsetting the increases in income from operations were the operating costs from the current year mergers and acquisitions of $10.6 million and increased stock compensation costs of $2.6 million.
Medical
| (Dollars in millions) | December 31, 2025 | December 31, 2024 | $ Change | % Change | |||||||||||||||||||
| Revenues | $ | 310.8 | $ | 299.7 | $ | 11.1 | 3.7 | % | |||||||||||||||
| Income from operations | $ | 46.9 | $ | 22.3 | $ | 24.6 | 110.3 | % | |||||||||||||||
| Income from operations as a % of revenues | 15.1 | % | 7.4 | % | |||||||||||||||||||
Medical segment revenues were $310.8 million for the year ended December 31, 2025 and $299.7 million for the year ended December 31, 2024, which is an increase of $11.1 million. Revenues increased due to $6.0 million of price increases, $2.7 million of revenue recoveries from operational delays in the comparable prior period, $1.4 million of foreign exchange fluctuations, and $1.0 million in organic volume growth. Organic volume growth is down from the prior year as a result of softer demand within the cancer care end-market in certain geographies.
Income from operations was $46.9 million for the year ended December 31, 2025 and loss from operations was $22.3 million for the year ended December 31, 2024, respectively, representing an increase in income from operations of $24.6 million. The increase in income from operations period over period was largely due to the increased revenues noted previously, improved margin mix, a reduction in amortization expense of $7.3 million, lower restructuring and related impairment costs of $3.4 million, and lower compensation costs of $1.6 million.
Corporate and other
Corporate and other costs include costs associated with our corporate headquarters located in Georgia, as well as centralized global functions including Executive, Finance, Legal and Compliance, Human Resources, Technology, Strategy, and Marketing and other costs related to company-wide initiatives.
Corporate and other costs were $96.5 million for the year ended December 31, 2025 and $76.4 million for the year ended December 31, 2024, which represents an increase in loss from operations of $20.1 million. The increase versus the comparable period was predominantly driven by one-time mergers and acquisition advisor expenses of $15.7 million and increased compensation costs of $6.2 million, partially offset by decreased stock compensation costs of $1.7 million (predominantly from lower incentive compensation) and other general corporate expenses.
43
For the Year Ended December 31, 2024 Compared to the Year Ended December 31, 2023
| (Dollars in millions) | Year Ended December 31, 2024 | Year Ended December 31, 2023 | $ Change | % Change | |||||||||||||||||||
| Revenues | $ | 860.8 | $ | 800.9 | $ | 59.9 | 7.5 | % | |||||||||||||||
| Cost of revenues | 461.1 | 444.5 | 16.6 | 3.7 | % | ||||||||||||||||||
| Gross profit | 399.7 | 356.4 | 43.3 | 12.1 | % | ||||||||||||||||||
| Selling, general and administrative expenses | 341.1 | 340.1 | 1.0 | 0.3 | % | ||||||||||||||||||
| Research and development | 35.0 | 31.7 | 3.3 | 10.4 | % | ||||||||||||||||||
| (Gain) loss on disposal of business | (1.2) | 6.5 | (7.7) | (118.5) | % | ||||||||||||||||||
| Income (loss) from operations | 24.8 | (21.9) | 46.7 | (213.2) | % | ||||||||||||||||||
| Interest expense, net | 51.3 | 57.1 | (5.8) | (10.2) | % | ||||||||||||||||||
| Loss on debt extinguishment | — | 2.6 | (2.6) | (100.0) | % | ||||||||||||||||||
| Foreign currency (gain)/loss, net | 2.2 | (0.3) | 2.5 | (833.3) | % | ||||||||||||||||||
| Increase in fair value of warrant liabilities | 5.3 | 24.8 | (19.5) | (78.6) | % | ||||||||||||||||||
| Other income, net | (0.1) | (0.8) | 0.7 | (87.5) | % | ||||||||||||||||||
| Loss before benefit from income taxes | (33.9) | (105.3) | 71.4 | (67.8) | % | ||||||||||||||||||
| Income tax expense (benefit) | 2.7 | (6.6) | 9.3 | (140.9) | % | ||||||||||||||||||
| Net loss | (36.6) | (98.7) | 62.1 | (62.9) | % | ||||||||||||||||||
| Loss attributable to noncontrolling interests | (0.5) | (1.8) | 1.3 | (72.2) | % | ||||||||||||||||||
| Net loss attributable to stockholders | $ | (36.1) | $ | (96.9) | $ | 60.8 | (62.7) | % | |||||||||||||||
Overview
Revenues for the year ended December 31, 2024 were $860.8 million resulting in an increase of $59.9 million, or 7.5%, from the prior year. Our Medical segment contributed $299.7 million and $284.5 million of revenues for the year ended December 31, 2024 and 2023, respectively. Our Nuclear & Safety segment contributed $561.1 million and $516.4 million of revenues for the year ended December 31, 2024 and 2023, respectively. Gross profit was $399.7 million and $356.4 million for the year ended December 31, 2024 and 2023, respectively, resulting in a $43.3 million increase from the prior year.
Net loss was $36.6 million and $98.7 million for the year ended December 31, 2024 and 2023, respectively. Our Medical segment contributed $22.3 million income from operations and $13.0 million income from operations for the year ended December 31, 2024 and 2023, respectively. Our Nuclear & Safety segment was responsible for $78.9 million income from operations and $46.0 million income from operations for the year ended December 31, 2024 and 2023, respectively. The overall decrease in net loss is primarily driven by increased revenues in both Medical and Nuclear & Safety segments, decreased amortization expense in the current year, lower selling, general and administrative costs associated with reduced stock-based compensation expense, lower net interest expense of $5.8 million, and a $19.5 million change in the loss from fair value of warrant liabilities. Partially offsetting these items were higher provision for/lower benefit from income taxes in the current year, increased restructuring costs due to the closure of our Middleton facility, and higher costs associated with information technology systems implementations and our global procurement office establishment.
Revenues
Revenues were $860.8 million for the year ended December 31, 2024 and $800.9 million for the year ended December 31, 2023, which represents a $59.9 million increase period over period. Revenues increased $15.6 million due to price increases, $41.0 million from volume growth, and $11.4 million due to the acquisition of the ec2 business. Partially offsetting the increases were reduced revenues from China and Russia in our Medical segment by $4.7 million, and reduced revenues from the disposal of Rehab by $3.6 million.
Medical segment revenues increased $15.2 million for the year ended December 31, 2024 compared with the year ended December 31, 2023 primarily due to price increases, organic volume growth, and the current year impact of the ec2 acquisition. Partially offsetting the increase in Medical segment revenues period over period were reduced revenues from China and Russia orders compared to the prior year and reduced revenues from the disposal of the Rehab business in the
44
prior year (see Note 2, Business Combinations, Acquisitions, and Business Disposals, to the Consolidated Financial Statements included elsewhere in this Annual Report on Form 10-K).
Nuclear & Safety segment revenues increased $44.7 million for the year ended December 31, 2024 compared with the year ended December 31, 2023 primarily due to price increases and organic volume growth, partially offset by projects execution timing.
Cost of revenues
Cost of revenues was $461.1 million for the year ended December 31, 2024 and $444.5 million for the year ended December 31, 2023, which represents a $16.6 million increase period over period.
Cost of revenues related to the Medical segment increased $6.6 million period over period due to an increase in cost of revenues due to higher operations from organic growth over the same period, increased depreciation, increased costs from the ec2 acquisition, and inflation, partially offset by a reduction of cost of revenues from the disposal of Rehab (see Note 2, Business Combinations, Acquisitions, and Business Disposals, to the Consolidated Financial Statements included elsewhere in this Annual Report on Form 10-K) and various cost productivity initiatives.
Cost of revenues related to the Nuclear & Safety segment increased $10.0 million period over period. The increase was primarily driven by increased revenues over the same period and inflation, partially offset by a positive product mix from higher margin projects and products in the current year, projects execution timing, and other cost saving initiatives.
Selling, general and administrative expenses
Selling, general and administrative (“SG&A”) expenses were $341.1 million for the year ended December 31, 2024 and $340.1 million for the year ended December 31, 2023, resulting in an increase of $1.0 million.
Our Medical segment incurred lower SG&A expenses of $0.5 million for the year ended December 31, 2024 compared to the previous period. The decrease was primarily due to decreased depreciation and amortization, bonus expenses in the current year, and lower SG&A expenses from the disposal of Rehab. Offsetting these increases were inflation, bad debt expense, higher SG&A associated with restructuring, and the impact from the ec2 acquisition.
Our Nuclear & Safety segment incurred higher SG&A expenses of $0.8 million for the year ended December 31, 2024 compared to the previous period. The increase was primarily driven by increased compensation and facility costs due to inflation and higher headcount in the current year, partially offset by decreased amortization expense resulting from fully amortized intangible assets.
Corporate SG&A expenses were $70.8 million for the year ended December 31, 2024 and $70.1 million for the year ended December 31, 2023. The higher SG&A expenses of $0.7 million were driven by a decrease in stock-based compensation expense under the 2021 Omnibus Incentive Plan and Profit Interests (see Note 15, Stock-Based Compensation, to the Consolidated Financial Statements included elsewhere this Annual Report on Form 10-K) and lower costs for mergers and acquisitions, partially offset by increased compensation costs, higher costs associated with information technology systems implementations and additional professional services associated with our global procurement office establishment.
Research and development
Research and development (“R&D”) expenses were $35.0 million for the year ended December 31, 2024 and $31.7 million for the year ended December 31, 2023, resulting in a increase of $3.3 million. The increase in R&D expense was primarily due to increased compensation costs (inflation and headcount) for the year ended December 31, 2024 as compared to the year ended December 31, 2023.
(Gain) loss on disposal of business
(Gain) loss on disposal of business were $(1.2) million and $6.5 million for the year ended December 31, 2024 and 2023, respectively, related to the sale of the Rehab business. For more information, see Note 2, Business Combinations, Acquisitions, and Business Disposals, to the Consolidated Financial Statements included elsewhere in this Annual Report on Form 10-K.
45
Income (loss) from operations
Income (loss) from operations were $24.8 million and $(21.9) million for the year ended December 31, 2024 and 2023, respectively, representing an increase of $46.7 million. On a segment basis, income from operations in the Medical segment were $22.3 million and $13.0 million for the year ended December 31, 2024 and 2023, respectively, representing an increase of $9.3 million. Income from operations in the Nuclear & Safety segment were $78.9 million and $46.0 million for the year ended December 31, 2024 and 2023, respectively, representing an increase of $32.9 million. Corporate expenses were $76.4 million and $80.9 million for the year ended December 31, 2024 and 2023, respectively, representing a decrease in loss from operations of $4.5 million. See “Business segments” and “Corporate and other” below for further details.
Interest expense
Interest expense, net, was $51.3 million for the year ended December 31, 2024 and $57.1 million for the year ended December 31, 2023. The decrease in interest expense was due to the $127.3 million early debt repayment using proceeds from the $150.0 million T. Rowe Price direct investment in 2023, lower interest rates negotiated with the debt refinancing during the year ended December 31, 2024, lower SOFR rates compared to prior year, interest from derivatives, and additional interest earned on cash deposits in the current year. For more information, see Note 8, Borrowings, and Note 19, Derivatives and Hedging, to the Consolidated Financial Statements included elsewhere in this Annual Report on Form 10-K.
Foreign currency (gain) loss, net
We recorded a loss of $2.2 million for the year ended December 31, 2024 and a gain of $0.3 million for the year ended December 31, 2023 from foreign currency exchange. The change in net foreign currency loss is due primarily to fluctuations in European local currencies in relation to the U.S. dollar.
Change in fair value of warrant liabilities
We recognized an unrealized loss of $5.3 million and $24.8 million for the year ended December 31, 2024 and 2023, respectively, representing a $19.5 million reduction in loss period over period. This change is due to the settlement of the Public Warrant and Private Placement Warrant liabilities in conjunction with the warrants redemptions/exchange during the year ended December 31, 2024 compared to the year ended December 31, 2023. See Note 1, Nature of Business and Summary of Significant Accounting Policies, and Note 18, Fair Value Measurements, to the Consolidated Financial Statements included elsewhere in this Annual Report on Form 10-K.
Income taxes
The effective income tax rate was (7.9)% and 6.3% for the year ended December 31, 2024 and December 31, 2023, respectively. The difference in effective tax rate between the periods was primarily attributable to mix of earnings and valuation allowances.
The effective income tax rate differs from the U.S. statutory rate of 21% due primarily to U.S. federal permanent differences and the impact of valuation allowances.
Business segments
The following provides detail for business segment results for the years ended December 31, 2024 and December 31, 2023. Segment income from operations includes revenues of the segment less expenses that are directly related to those revenues but excludes certain charges to cost of revenues and selling, general and administrative expenses predominantly related to corporate costs, which are included in Corporate and Other in the table below. Interest expense, loss on debt extinguishment, foreign currency loss (gain), net, and other expense (income), net, are not allocated to segments.
For reconciliations of segment revenues and operating income to our consolidated results, see Note 17, Segment Information, to the Consolidated Financial Statements included elsewhere in this Annual Report on Form 10-K.
46
Medical
| (Dollars in millions) | December 31, 2024 | December 31, 2023 | $ Change | % Change | |||||||||||||||||||
| Revenues | $ | 299.7 | $ | 284.5 | $ | 15.2 | 5.3 | % | |||||||||||||||
| Income (loss) from operations | $ | 22.3 | $ | 13.0 | $ | 9.3 | 71.5 | % | |||||||||||||||
| Income (loss) from operations as a % of revenues | 7.4 | % | 4.6 | % | |||||||||||||||||||
Medical segment revenues were $299.7 million for the year ended December 31, 2024 and $284.5 million for the year ended December 31, 2023, which is an increase of $15.2 million. Revenues increased $12.1 million due to price increases and volume growth excluding China and Russia, and $11.4 million due to the acquisition of the ec2 business. Partially offsetting the increase in the Medical segment revenues period over period were reduced revenues from the disposal of Rehab by $3.6 million and reduced revenues from China , due to increased regulation requirements, and Russia due to geopolitical impacts, compared to the prior year by $4.7 million.
Income from operations was $22.3 million for the year ended December 31, 2024 and loss from operations was $13.0 million for the year ended December 31, 2023, respectively, representing an increase in income from operations of $9.3 million. The increase in income from operations period over period was largely due to the increased revenues noted previously, lower bonus expenses of $3.3 million, and a net impact from the ec2 business of $1.9 million. Partially offsetting the increase in income were higher restructuring and related impairment costs of $4.2 million, and $0.9 million of additional bad debt expense in the current year.
Nuclear & Safety
| (Dollars in millions) | December 31, 2024 | December 31, 2023 | $ Change | % Change | |||||||||||||||||||
| Revenues | $ | 561.1 | $ | 516.4 | $ | 44.7 | 8.7 | % | |||||||||||||||
| Income (loss) from operations | $ | 78.9 | $ | 46.0 | $ | 32.9 | 71.5 | % | |||||||||||||||
| Income (loss) from operations as a % of revenues | 14.1 | % | 8.9 | % | |||||||||||||||||||
Nuclear & Safety segment revenues were $561.1 million for year ended December 31, 2024 and $516.4 million for the year ended December 31, 2023, representing an increase of $44.7 million. The increase is primarily driven from price increases and volume growth.
Income from operations was $78.9 million for the year ended December 31, 2024 and $46.0 million for the year ended December 31, 2023. Income from operations increased $32.9 million period over period driven primarily by the changes in revenues described above, improved gross margins due to a positive product mix compared to prior year, and $10.7 million in lower amortization expenses due to fully amortized intangible assets. Partially offsetting the increases in income from operations were increased compensation costs of $6.1 million and increased facility costs of $2.4 million (primarily utilities and repairs and maintenance costs).
Corporate and other
Corporate and other costs were $76.4 million for the year ended December 31, 2024 and $80.9 million for the year ended December 31, 2023, which represents a decrease of $4.5 million. The decrease versus the comparable period was predominantly driven by a decrease in stock-based compensation expense of $7.3 million (see Note 15, Stock-Based Compensation, to the Consolidated Financial Statements included elsewhere in this Annual Report on Form 10-K), and a $3.8 million reduction in mergers and acquisitions costs, offset by an increase of $3.1 million in compensation expenses, $1.5 million in informational technology systems implementation costs, and $3.0 million in professional services related to the establishment of our global procurement office. For reconciliations of segment operating income and corporate and other costs to our consolidated results, see Note 17, Segment Information, to the Consolidated Financial Statements included elsewhere in this Annual Report on Form 10-K.
47
Liquidity and Capital Resources
Overview of Liquidity
Our primary future cash needs relate to working capital, operating activities, capital spending, strategic investments, and debt service.
Mirion management believes that net cash provided by operating activities, augmented by long-term debt arrangements, will provide adequate liquidity for the next 12 months of independent operations, as well as the resources necessary to invest for growth in existing businesses and manage its capital structure on a short- and long-term basis. Access to capital and availability of financing on acceptable terms in the future will be affected by many factors, including our credit rating, economic conditions, and the overall liquidity of capital markets. There can be no assurance of continued access to financing from the capital markets on acceptable terms or at all.
At December 31, 2025 and December 31, 2024, we had $412.3 million and $175.2 million, respectively, in cash and cash equivalents, which include amounts held by entities outside of the United States of approximately $205.7 million and $131.9 million, respectively, primarily in Europe and Canada. Non-U.S. cash is generally available for repatriation without legal restrictions, subject to certain taxes, mainly withholding taxes. We are asserting indefinite reinvestment of cash for certain non-U.S. subsidiaries. The Company has alternative repatriation options other than dividends should the need arise. The 2021 Credit Agreement provides for up to $175.0 million of revolving borrowings. The amount available on the revolver as of December 31, 2025 and December 31, 2024 was approximately $159.3 million and $72.1 million, respectively.
For information on our lease commitments and other commitments and contingencies, see Note 10, Leased Assets, and Note 11, Commitments and Contingencies, respectively, to the Consolidated Financial Statements, included elsewhere in this Annual Report on Form 10-K.
Debt Profile
2021 Credit Agreement
The Company maintains a credit agreement (the “2021 Credit Agreement”) among Mirion IntermediateCo Inc., a Delaware corporation, as Holdings, Mirion Technologies (US Holdings), Inc., as the Parent Borrower, Mirion Technologies (US), Inc., as the Subsidiary Borrower, the lending institutions party thereto, and Citibank, N.A., as the Administrative Agent and Collateral Agent.
The 2021 Credit Agreement provides for an $830.0 million senior secured first lien term loan facility and a $175.0 million senior secured revolving facility (collectively, the “Credit Facilities”). The term loan facility is scheduled to mature on June 5, 2032 and the revolving facility is scheduled to expire and mature on March 21, 2030 (subject to other terms and conditions). The agreement requires the payment of a commitment fee of 0.50% per annum for unused revolving commitments, subject to stepdowns to 0.375% per annum and 0.25% per annum upon the achievement of specified leverage ratios. Any outstanding letters of credit issued under the 2021 Credit Agreement reduce the availability under the revolving line of credit.
The 2021 Credit Agreement is secured by a first priority lien on the equity interests of the Parent Borrower owned by Holdings and substantially all of the assets (subject to customary exceptions) of the borrowers and the other guarantors thereunder. Interest with respect to the facilities is based on, at the option of the borrowers, (i) a customary base rate formula for borrowings in U.S. dollars or (ii) a floating rate formula based on London interbank offered rate (“LIBOR”) (with customary fallback provisions described below) for borrowings in U.S. dollars, a floating rate formula based on EURIBOR for borrowings in Euro or a floating rate formula based on SONIA for borrowings in Pounds Sterling, each as described in the 2021 Credit Agreement with respect to the applicable type of borrowing. The 2021 Credit Agreement includes fallback language that seeks to either facilitate an agreement with our lenders on a replacement rate for LIBOR in the event of its discontinuance or that automatically replaces LIBOR with benchmark rates based on the Secured Overnight Financing Rate ("SOFR") or other benchmark replacement rates upon triggering events.
On June 23, 2023, the 2021 Credit Agreement was amended, among other things, to replace the interest rate based on LIBOR and related LIBOR-based mechanics applicable to U.S. Dollar borrowings under the Credit Agreement with an interest rate based on SOFR (including, solely with respect to currently outstanding term loans, a customary spread adjustment of 0.11448%, 0.26161%, and 0.42826% for borrowing with interest periods of 1, 3, and 6 months, respectively) and related SOFR-based mechanics.
48
The 2021 Credit Agreement contains customary representations and warranties as well as customary affirmative and negative covenants and events of default. The negative covenants include, among others and in each case subject to certain thresholds and exceptions, limitations on incurrence of liens, limitations on incurrence of indebtedness, limitations on making dividends and other distributions, limitations on engaging in asset sales, limitations on making investments, and a financial covenant that the “First Lien Net Leverage Ratio” (as defined in the 2021 Credit Agreement) as of the end of any fiscal quarter is not greater than 7.00 to 1.00 if on the last day of such fiscal quarter certain borrowings outstanding under the revolving credit facility exceed 40% of the total revolving credit commitments at such time. The covenants also contain limitations on the activities of Mirion IntermediateCo, Inc. as the “passive” holding company. If any of the events of default occur and are not cured or waived, any unpaid amounts under the 2021 Credit Agreement may be declared immediately due and payable, the revolving credit commitments may be terminated and remedies against the collateral may be exercised. Mirion IntermediateCo, Inc. was in compliance with all debt covenants on December 31, 2025 and December 31, 2024.
Term Loan - The term loan initially had a seven-year term (expiring October 2028) and bore interest at the greater of LIBOR (through June 30, 2023) / SOFR (subsequent to June 30, 2023 through May 21, 2024) or 0.50%, plus 2.75%. On May 22, 2024, the Company entered into Amendment No. 3 (“Amendment No. 3”) to the Credit Agreement. Amendment No. 3 reduced the applicable margin rate on the term loans from 2.75% to 2.25% and reduced the credit spread based upon rate term to 0%, with other terms and conditions remaining consistent (effectively the existing loan was refinanced). Amendment No. 3 was accounted for prospectively as a debt modification in accordance with ASC 470-50, Debt—Modifications and Extinguishments.
On June 5, 2025, the Company entered into Amendment No. 5 to the 2021 Credit Agreement ("Amendment No. 5"). Under Amendment No. 5, the Company utilized funds from the private offering of Convertible Senior Notes due 2030 completed on May 23, 2025 (see Note 9, Convertible Debt) to repay $244.6 million in outstanding principal and $8.3 million in accrued interest as well as to extend the maturity date of the term loan to June 5, 2032 (collectively, the "June 2025 Refinancing"). The June 2025 Refinancing was accounted for as a partial extinguishment and partial modification of the term loan debt. The Company accounted for $244.6 million of the term loan principal as an extinguishment of debt; the remaining $450.0 million of principal was accounted for as a modification to the extent the principal holdings at the syndicated lender level remained unchanged. As a result, the Company recorded a loss on partial debt extinguishment of $5.8 million within the Consolidated Statement of Operations for the period ended December 31, 2025 attributed to the derecognition of a proportionate amount of unamortized deferred financing costs.
On December 8, 2025, the Company entered into Amendment No. 6 to the 2021 Credit Agreement ("Amendment No. 6"). Amendment No. 6 reduced the applicable margin rate on the term loans from 2.25% to 2.00%, with other terms and conditions remaining consistent (effectively the existing loan was refinanced). Amendment No. 6 was accounted for prospectively as a debt modification in accordance with ASC 470-50, Debt—Modifications and Extinguishments.
The interest rate was 5.78% and 6.85% as of December 31, 2025, and December 31, 2024, respectively. The Company repaid $244.6 million and zero for the period ended December 31, 2025, and the period ended December 31, 2024, respectively.
Revolving Line of Credit - The revolving line of credit arrangement initially had a five year term (expiring October 2026) and bore interest at the greater of LIBOR (through June 30, 2023) / SOFR (subsequent to June 2023) or 0%, plus 2.25%. The terms of the revolving line of credit were amended on March 21, 2025, through Amendment No. 4 to the 2021 Credit Agreement ("Amendment No. 4"). Under Amendment No. 4, revolving credit commitments from lenders increased from $90.0 million to $175.0 million, and the maturity date extended to March 21, 2030, subject to a "springing" maturity date that is 91 days prior to the maturity date of the outstanding term loan under the 2021 Credit Agreement (but only to the extent the outstanding principal amount of the term loan exceeds $100.0 million on the date of determination, and a final statement maturity date that is early than 91 days after March 21, 2030).
The 2021 Credit Agreement requires the payment of a commitment fee of 0.25% per annum for unused commitments. Any outstanding letters of credit reduce the availability of the revolving line of credit. There was no outstanding balance under the arrangement as of December 31, 2025, and December 31, 2024. Additionally, the Company has standby letters of credit issued under its 2021 Credit Agreement that reduce the availability under the revolver of $15.7 million and $17.9 million as of December 31, 2025, and December 31, 2024, respectively. The amount available on the revolver as of December 31, 2025, and December 31, 2024 was approximately $159.3 million and $72.1 million, respectively.
Convertible Senior Notes due 2030
On May 23, 2025, the Company completed a private offering of $400.0 million in aggregate principal amount of 0.25% Convertible Senior Notes due 2030, including the initial purchasers’ exercise in full of their option to purchase additional Notes (the “2030 Notes”). The 2030 Notes were issued pursuant to an indenture, dated May 23, 2025 (the “May
49
Indenture”). The May Indenture includes customary covenants and sets forth certain events of default after which the 2030 Notes may be declared immediately due and payable and sets forth certain types of bankruptcy or insolvency events of default involving the Company after which the outstanding principal and accrued interest of the 2030 Notes becomes automatically due and payable.
The 2030 Notes will mature on June 1, 2030, unless earlier converted, redeemed or repurchased. The 2030 Notes will bear interest from May 23, 2025 at a rate of 0.25% per year payable semiannually in arrears on June 1 and December 1 of each year, beginning on December 1, 2025. The 2030 Notes will be convertible at the option of the holders in certain circumstances discussed below. The 2030 Notes will be convertible into cash, shares of Mirion’s Class A common stock or a combination of cash and shares of Mirion’s Class A common stock, at the Company’s election.
The initial conversion rate is 43.2751 shares of Mirion’s Class A common stock per $1,000 principal amount of 2030 Notes, which is equivalent to an initial conversion price of approximately $23.11 per share of Mirion's Class A common stock. The initial conversion price of the 2030 Notes represents a conversion premium of 32.5% to the last reported sale price of Mirion’s Class A common stock of $17.44 per share on May 20, 2025. The conversion rate is subject to adjustment under certain circumstances in accordance with the terms of the May Indenture.
The Company may not redeem the 2030 Notes prior to June 6, 2028. The Company may redeem for cash 100% of the principal amount of the 2030 Notes being redeemed plus accrued and unpaid interest or any portion of the 2030 Notes, at its option, on or after June 6, 2028, but only if a certain liquidity condition has been satisfied and the last reported sale price of Mirion's Class A common stock has been at least 130% of the conversion price then in effect for at least 20 trading days (whether or not consecutive) during any 30 consecutive trading day period. If the Company redeems less than all of the outstanding 2030 Notes, at least $100.0 aggregate principal amount of the 2030 Notes must be outstanding and not subject to redemption as of, and after giving effect to, delivery of the relevant redemption notice.
If the Company undergoes a fundamental change at any point, as defined in the May Indenture, then subject to certain conditions and limited exceptions, holders may require the Company to repurchase for cash all or any portion of their 2030 Notes in principal amounts of $1,000 or an integral multiple thereof at a repurchase price equal to 100% of the principal amount of the 2030 Notes to be repurchased plus accrued and unpaid interest. In addition, if specific corporate events occur prior to the maturity date or if the Company issues a notice of redemption, the Company will increase the conversion rate for holders who elect to convert their 2030 Notes in connection with such a corporate event. The conditions allowing holders of the 2030 Notes to convert were not met during the year ended December 31, 2025.
Convertible Senior Notes due 2031
On September 30, 2025, concurrently with an offering of Mirion's Class A common stock, the Company completed a private offering of $375.0 million in aggregate principal amount of 0.00% Convertible Senior Notes due 2031, including the initial purchasers’ exercise in full of their option to purchase additional Notes (the “2031 Notes”). The 2031 Notes were issued pursuant to an indenture, dated September 30, 2025 (the “September Indenture”). The September Indenture includes customary covenants and sets forth certain events of default after which the 2031 Notes may be declared immediately due and payable and sets forth certain types of bankruptcy or insolvency events of default involving the Company after which the outstanding principal and any unpaid special interest of the 2031 Notes becomes automatically due and payable.
The 2031 Notes will mature on October 1, 2031, unless earlier converted, redeemed or repurchased. The 2031 Notes will not bear regular interest, and the principal amount of the 2031 Notes will not accrete. Special interest will accrue on the 2031 Notes in the circumstances at the rates set forth within the September Indenture. The 2031 Notes will be convertible at the option of the holders in certain circumstances discussed below. The 2031 Notes will be convertible into cash, shares of Mirion’s Class A common stock or a combination of cash and shares of Mirion’s Class A common stock, at the Company’s election.
The initial conversion rate is 34.6951 shares of Mirion’s Class A common stock per $1,000 principal amount of 2031 Notes, which is equivalent to an initial conversion price of approximately $28.82 per share of Mirion's Class A common stock. The initial conversion price of the 2031 Notes represents a conversion premium of 35.0% to the related public offering price per share of Mirion Class A common stock of $21.35 per share. The conversion rate is subject to adjustment under certain circumstances in accordance with the terms of the September Indenture.
The Company may not redeem the 2031 Notes prior to October 5, 2028. The Company may redeem for cash 100% of the principal amount of the 2031 Notes being redeemed plus any unpaid special interest or any portion of the 2031 Notes, at its option, on or after October 5, 2028, but only if a certain liquidity condition has been satisfied and the last reported sale price of Mirion's Class A common stock has been at least 130% of the conversion price then in effect for at least 20 trading days (whether or not consecutive) during any 30 consecutive trading day period. If the Company redeems less than all of
50
the outstanding 2031 Notes, at least $100.0 million aggregate principal amount of the 2031 Notes must be outstanding and not subject to redemption as of, and after giving effect to, delivery of the relevant redemption notice.
If the Company undergoes a fundamental change at any point, as defined in the September Indenture, then subject to certain conditions and limited exceptions, holders may require the Company to repurchase for cash all or any portion of their 2031 Notes in principal amounts of $1,000 or an integral multiple thereof at a repurchase price equal to 100% of the principal amount of the 2031 Notes to be repurchased plus any unpaid special interest. In addition, if specific corporate events occur prior to the maturity date or if the Company issues a notice of redemption, the Company will increase the conversion rate for holders who elect to convert their 2031 Notes in connection with such a corporate event. The conditions allowing holders of the 2031 Notes to convert were not met during the year ended December 31, 2025.
Interest and Maturity
As of December 31, 2025, the 2030 Notes and 2031 Notes are classified as long-term liabilities, net of issuance costs of $12.4 million and $9.9 million, respectively, on the Consolidated Balance Sheets. As of December 31, 2025, the net carrying amount of the 2030 Notes and 2031 Notes approximates fair value. As the 2030 Notes and 2031 Notes were not issued at a premium, no portion of the proceeds from the issuance of the 2030 Notes and 2031 Notes met the requirements to be accounted for separately as a component of stockholders’ equity. The 2030 Notes and 2031 Notes were issued at par, and costs associated with the issuance of the 2030 Notes and 2031 Notes are amortized to interest expense over the contractual term of the respective Notes. Interest expense (including amortization of deferred issuance costs) recognized related to the 2030 Notes and the 2031 Notes for the year ended December 31, 2025 was $2.2 million and $0.4 million, respectively. No special interest was recorded for the 2031 Notes during the year ended December 31, 2025. As of December 31, 2025, the effective interest rate of the 2030 Notes is 0.88%.
The net proceeds from the issuance of the 2030 Notes was approximately $387.7 million and was used as follows: $31.0 million to repurchase shares of Mirion’s Class A Common Stock, $44.6 million to pay the cost of Capped Call Transactions, $256.0 million to refinance the term loan (principal repayment, accrued interest and financing fees), and the balance for general corporate purposes and working capital.
The net proceeds from the issuance of the 2031 Notes was approximately $365.1 million and was received in conjunction with $409.7 million in net proceeds from the concurrent offering of Mirion's Class A common stock completed on September 30, 2025. The proceeds were used as follows: $581.3 million for the acquisition of the Paragon business, $38.0 million to pay the cost of Capped Call Transactions, and the balance for general corporate purposes and working capital.
For more discussion on the Company's debt profile, see Note 8, Borrowings, and Note 9, Convertible Debt, to the Consolidated Financial Statements included elsewhere in this Form 10-K.
Share Repurchase Program
In December 2024, we instituted a share repurchase program for up to $100 million of the currently outstanding shares of our Class A common stock, as approved by our Board of Directors. Under the share repurchase program, we intend to repurchase shares through open market purchases, privately negotiated transactions, block purchases and otherwise in accordance with applicable federal securities laws, including Rule 10b-18 of the Exchange Act. We have repurchased 1.2 million shares under this program as of December 31, 2025 for $18.6 million.
Hedges
As a result of the Company’s European operations, we are exposed to fluctuations in exchange rates between the Euro and U.S. dollar (our functional currency). As such, we entered into cross-currency rate swaps during the year ended December 31, 2022, to manage currency risks related to foreign exchange in foreign operations. During the year ended December 31, 2024, the Company extended a cross-currency rate swap derivative by one-year (notional amount of 123.2 million euros). During the year ended December 31, 2025, the Company extended the same cross-currency rate swap derivative by two years. The Company is also subject to interest rate risk related to the Credit Facilities. As such, we entered into an interest rate swap (notional amount of $75.0 million) during the year ended December 31, 2023, as well as an additional interest rate swap (notional amount of $100.0 million) during the year ended December 31, 2025 to mitigate the risk of adverse changes in benchmark interest rates on the Company's future interest payments (collectively, the "interest rate swaps").
The interest rate swaps are derivative financial instrument that have been designated and qualify as cash flow hedges. The changes in the fair values of the cash flow hedges are recorded in accumulated other comprehensive loss (“AOCL”) and are reclassified into the line item in our Consolidated Statements of Operations in which the hedged items are recorded in the same period the hedged items affect earnings. The changes in the fair values of hedges that are determined to be ineffective
51
are immediately reclassified from AOCL into earnings. During the year ended December 31, 2025, the interest rate swap resulted in a loss of $0.4 million recognized in other comprehensive income ("OCI"). Gains of $0.7 million were recognized in income through interest expense and reclassified from OCI during the same periods.
The cross-currency rate swaps are derivative financial instruments that have been designated and qualify as hedges of net investments in our foreign operations. Accordingly, the changes in the fair values of the swaps are recognized in net investment hedges adjustments, a component of AOCL, to offset the changes in the values of the net investments being hedged. Any ineffective portions of net investment hedges are reclassified from AOCL into earnings during the period of change. The following table summarizes the notional values and pretax impact of changes in the fair values of instruments designated as net investment hedges (in millions):
| Notional Amount | Gain (Loss) Recognized in AOCL | ||||||||||||||||||||||||||||
| As of | Year Ended December 31, 2025 | Year Ended December 31, 2024 | Year Ended December 31, 2023 | ||||||||||||||||||||||||||
| December 31, 2025 | December 31, 2024 | ||||||||||||||||||||||||||||
| Cross-currency rate swaps | € | 238.8 | € | 238.8 | $ | (32.4) | $ | 15.2 | $ | (10.4) | |||||||||||||||||||
| Total | € | 238.8 | € | 238.8 | $ | (32.4) | $ | 15.2 | $ | (10.4) | |||||||||||||||||||
For more discussion of the hedges of net investments and cash flows, see Note 18, Fair Value Measurement, and Note 19, Derivatives and Hedging, to the Consolidated Financial Statements included elsewhere in this Annual Report on Form 10-K.
Cash Flows
| (In millions) | Fiscal Year Ended December 31, 2025 | Fiscal Year Ended December 31, 2024 | Fiscal Year Ended December 31, 2023 | ||||||||||||||
| Net cash provided by operating activities | $ | 143.3 | $ | 99.1 | $ | 95.2 | |||||||||||
| Net cash used in investing activities | $ | (694.6) | $ | (43.7) | $ | (64.7) | |||||||||||
| Net cash provided by (used in) financing activities | $ | 775.9 | $ | (3.3) | $ | 22.6 | |||||||||||
Year ended December 31, 2025 as compared to year ended December 31, 2024
Net Cash Provided by Operating Activities
Operating activities provided net cash of $143.3 million for the year ended December 31, 2025, as compared to net cash provided of $99.1 million for the year ended December 31, 2024. The increase in net cash provided by operating activities was $44.2 million. The change is primarily due to an increase in net income of $66.4 million and $10.2 million from changes in various items in net working capital, partially offset by $19.6 million of foreign currency translation adjustments and $12.4 million from the decrease in depreciation and amortization expense.
Net Cash Used in Investing Activities
Net cash used in investing activities was $694.6 million for the year ended December 31, 2025 as compared to net cash used of $43.7 million for the year ended December 31, 2024. The increase in net cash used of $650.9 million was driven primarily by the $581.3 million outflow for the acquisition of the Paragon business and the $80.6 million outflow for the acquisition of the Certrec business, partially offset by a $12.4 million decrease in capital expenditures related to purchases of badges and related software supporting our launch of the Instadose Vue product in the prior year.
Net Cash Provided by (Used in) Financing Activities
Net cash used provided by financing activities was $775.9 million for the year ended December 31, 2025 as compared to net cash used of $3.3 million during the year ended December 31, 2024. The increase in net cash provided of $779.2 million primarily relates to the debt transactions described above in the Liquidity and Capital Resources section ($755.0 million from the issuance of convertible senior notes) and $409.7 million from the issuance of common stock net of issuance costs, offset by term loan principal repayments of $244.6 million, $82.6 million of purchases of capped calls
52
related to convertible senior notes, and repurchases of Company stock for treasury and tax witholdings for vesting restricted stock units of $56.0 million.
Year ended December 31, 2024 as compared to year ended December 31, 2023
Net Cash Provided by Operating Activities
Operating activities provided net cash of $99.1 million for the year ended December 31, 2024, as compared to net cash provided of $95.2 million for the year ended December 31, 2023. The increase in net cash provided by operating activities was $3.9 million. The primary causes of the change were an improvement in net loss of $62.1 million, partially offset by a $19.5 million decrease in the loss from fair values of warrant liabilities which were redeemed during 2024, a $7.2 million decrease in loss on disposal of business related to the Rehab business, a $6.3 million decrease in stock compensation expense primarily due to the completed vesting of profit interests and a $26.1 million decrease in cash flows from operating assets and liabilities. The decrease in cash flows from operating assets and liabilities was primarily the result of a $42.1 million increase in contracts in progress (see Note 3, Contracts in Progress,to the Consolidated Financial Statements included elsewhere in this Annual Report on Form 10-K) due to both an increased number of contracts and timing of milestone billing as compared to prior year, partially offset by an increased cash flow of $11.3 million in Accrued expenses and other current liabilities due to increased customer deposits for new contracts and other increased accrued liabilities (primarily bonus and income taxes) for the fiscal year ended December 31, 2024 compared to the fiscal year ended December 31, 2023.
Net Cash Used in Investing Activities
Net cash used in investing activities was $43.7 million for the year ended December 31, 2024 as compared to net cash used of $64.7 million for the year ended December 31, 2023. The decrease in net cash used of $21.0 million was driven primarily by the $31.4 million cash consideration paid for the purchase of ec2 during the fiscal year ended December 31, 2023, offset by the $11.7 million increase in purchases of property, plant and equipment, primarily in support of our InstadoseVUE badge product introduction in our dosimetry services business and continued investment in digital products across both segments.
Net Cash (Used in) Provided by Financing Activities
Net cash used in financing activities was $3.3 million for the year ended December 31, 2024 as compared to net cash provided of $22.6 million during the year ended December 31, 2023. The decrease in net cash provided of $25.9 million was primarily due to the $22.7 million change relating to the $150.0 million of gross proceeds received from the T. Rowe direct investment in the prior year partially offset by debt repayments made with those funds of $127.3 million.
Critical Accounting Policies and Estimates
Our Consolidated Financial Statements are prepared in accordance with U.S. GAAP. The preparation of these financial statements requires management to make estimates and assumptions that affect the reported amounts of assets, liabilities, revenues, costs and expenses and related disclosures. Such estimates are based on historical experience and on various other factors that management believes are reasonable under the circumstances, the results of which form the basis for making judgments about the carrying value of assets and liabilities that are not readily apparent from other sources. Actual results may differ from these judgments and estimates under different assumptions or conditions and any such differences may be material. We believe that the accounting policies discussed below are critical to understanding historical and future performance, as these policies relate to the more significant areas involving management's judgments and estimates.
Business Combinations
We account for business acquisitions in accordance with ASC 805, "Business Combinations." This standard requires the acquiring entity in a business combination to recognize all the assets acquired and liabilities assumed in the transaction and establishes the acquisition date fair value as the measurement objective for all assets acquired and liabilities assumed in a business combination. Certain provisions of this standard prescribe, among other things, the determination of acquisition date fair value of consideration paid in a business combination (including contingent consideration) and the exclusion of transaction and acquisition-related restructuring costs from acquisition accounting.
The determination of the fair value of assets acquired and liabilities assumed involves assessments of factors such as the expected future cash flows associated with individual assets and liabilities and appropriate discount rates at the closing date
53
of the acquisition. For non-observable market values, the Company determines fair value using acceptable valuation principles (e.g., multiple excess earnings, relief from royalty and cost methods).
Goodwill
Goodwill represents the excess of the purchase price paid over the estimated fair value of the net assets acquired and liabilities assumed in the acquisition of a business.
Goodwill has an indefinite useful life, and is not amortized, but instead tested for impairment annually as of October 1 or more often if events or changes in circumstances indicate that the carrying amount may exceed fair value as set forth in ASC 350, “Intangibles — Goodwill and Other.” The Company tests for goodwill impairment at the reporting unit level, which is an operating segment or one level below an operating segment. The amount of goodwill acquired in a business combination that is assigned to one or more reporting units as of the acquisition date is the excess of the purchase price of the acquired businesses (or portion thereof) included in the reporting unit, over the fair value assigned to the individual assets acquired or liabilities assumed from a market participant perspective. Goodwill is assigned to the reporting unit(s) expected to benefit from the synergies of the combination even though other assets or liabilities of the acquired entity may not be assigned to that reporting unit.
ASC 350 allows an optional qualitative assessment as part of annual impairment testing, prior to a quantitative assessment test, to determine whether it is more likely than not that the fair value of a reporting unit exceeds its carrying amount. If a qualitative assessment determines an impairment is more likely than not, the Company is required to perform a quantitative impairment test. Otherwise, no further analysis is required. Alternatively, the Company may elect to proceed directly to the quantitative impairment test.
In conducting a qualitative assessment, the Company analyzes actual and projected growth trends for net sales and margin for each reporting unit, as well as historical performance versus plan and the results of prior quantitative tests performed. Additionally, the Company assesses factors that may impact its business, including macroeconomic conditions and the related impact, market-related exposures, plans to market for sale all or a portion of the business, competitive changes, new or discontinued product lines, changes in key personnel, and any potential risks to projected financial results.
If performed, the quantitative test compares the fair value of a reporting unit with its carrying amount. We determine the fair value of each reporting unit by estimating the present value of expected future cash flows, discounted by the applicable discount rate, and/or peer company multiples. If the carrying value exceeds the fair value, the Company recognizes an impairment loss in the amount equal to the excess, not to exceed the total amount of goodwill allocated to that reporting unit.
The Company may reorganize its reporting unit structure to better align the Company's operations within its reporting unit structure. In such cases, the Company assesses and re-defines reporting units effective as of the reorganization date including reallocation of goodwill on a relative fair value basis as applicable to affected reporting units. Goodwill impairment analysis will be performed as of the effective reorganization date both before and after the reorganization to test for any goodwill impairment. Refer to Note 7, Goodwill and Intangible Assets, for further detail.
Intangible Assets
Intangible assets relate to the value associated with our developed technology, customer relationships, remaining performance obligations, and trade names at the time of acquisition through business combinations.
The Company determined the fair value of intangible assets acquired through an income approach, using the excess earnings method for customer relationships and remaining performance obligations. Under the excess earnings method, an intangible asset’s fair value is equal to the present value of the incremental after-tax cash flows attributable solely to the intangible asset over its remaining useful life. The relief from royalty method was used to determine the fair value of developed technology and trade name. The valuation models were based on estimates of future operating projections of the acquired business and rights to sell products as well as judgments on the discount rates used and other variables. We determined the forecasts based on a number of factors, including our best estimate of near-term net sales expectations and long-term projections, which include review of internal and independent market analyses. The discount rate used was representative of the weighted average cost of capital.
The customer relationships definite lived intangible assets are amortized either using the double declining balance method or on a straight-line basis, with estimated useful lives ranging from 6 to 13 years, while all other definite lived intangible assets are amortized on a straight-line basis over their estimated useful lives, ranging from 5 to 16 years for developed
54
technology and 1 to 10 years for trade names and other. The Company regularly evaluates the amortization period assigned to each intangible asset to ensure that there have not been any events or circumstances that warrant revised estimates of useful lives. Refer to Note 7, Goodwill and Intangible Assets, for further detail.
Revenue Recognition
The Company recognizes revenue from arrangements that include performance obligations to design, engineer, manufacture, deliver, and install products. The Company identifies a performance obligation for each promise in a contract to transfer a distinct good or service to the customer. As part of its assessment, the Company considers all goods and/or services promised in the contract, regardless of whether they are explicitly stated or implied by customary business practices. The Company’s contracts may contain either a single performance obligation, including the promise to transfer individual goods or services that are not separately distinct within the context of the respective contracts, or multiple performance obligations. For contracts that contain multiple performance obligations, the Company allocates the consideration to which it expects to be entitled to each performance obligation based on relative standalone selling prices and recognizes the related revenue when or as control of each individual performance obligation is transferred to customers. The Company does not assess whether promised goods or services are performance obligations if they are immaterial in the context of the contract with the customer. The Company combines multiple contracts entered into at or around the same time with a customer if the contracts are negotiated as a package with a single commercial objective, the consideration paid under the contracts depends on the price or performance of the other contract, or if the goods or services promised in the contracts are a single performance obligation.
In most cases, installation services represent a separate performance obligation. The customer simultaneously receives and consumes the benefits as the installation services are performed. The Company determines if the installation is a separate performance obligation by evaluating whether the service is distinct within the context of the contract and capable of being distinct. In evaluating whether the installation service is capable of being distinct, we consider whether other entities could complete the installation (based on the technical complexity of the service) and whether third parties offer a similar installation service. When the product and installation service are determined to be a combined performance obligation, revenue is recognized over time as the installation is performed and included in product revenue in the consolidated statement of operations.
The Company’s costs to obtain contracts are typically comprised of sales commissions. A majority of these costs relate to revenue that is recognized over a period that is less than one year. For costs related to revenue recognized over a period less than one year, the Company has elected the practical expedient under ASC 606 to expense these costs as incurred. The amount of deferred cost assets and related amortization was immaterial to our financial statements.
Assurance-type warranties guarantee that a product complies with agreed-upon specifications and accordingly are not separate performance obligations. A provision for the cost of fulfilling these warranties is recognized in the period during which the associated revenue is recognized.
Variable consideration such as sales rebates, sales discounts and sales returns are estimated and treated as a reduction of revenue in the same period the related revenue is recognized. These are estimated based on contractual terms, historical practices, and current trends, and are adjusted as new information becomes available. In some of our long contracts, variable consideration includes future increases based on published price indexes in the country of the underlying contract. We constrain our estimate of this variable consideration until the price index has been published by the applicable authority. Revenues exclude any taxes that the Company collects from customers and remits to tax authorities. Amounts billed to customer for shipping and handling are included in revenue, while the related shipping and handling costs are reflected in cost of products in the period in which revenue is recognized. The Company has elected a practical expedient under ASC 606 that allows for shipping and handling activities that occur after the customer has obtained control of a good to be accounted for as a fulfillment cost. The Company does not adjust the promised amount of consideration for the effects of a significant financing component, if, at contract inception, the Company expects the period between the time when the Company transfers a promised good or service to the customer and the time when the customer pays for that good or service will be one year or less.
Certain of the Company’s products are sold through distributors and third-party sales representatives under standard agreements whereby distributors purchase products from the Company and resell them to customers. These agreements give distributors the right to sell the Company’s products within certain territories and establish minimum order requirements. These arrangements do not provide stock rotation or price protection rights and do not contain extended payment terms. Rights of return are limited to repair or replacement of delivered products that are defective or fail to meet the Company’s published specifications. Provisions for these warranty costs are recognized in the same period that the related revenue is recorded similar to other assurance-type warranties.
55
Performance Obligations Satisfied Over Time:
The Company exercises judgment in determining the timing of revenue by analyzing the point in time or the period over which the customer has the ability to direct the use of and obtain substantially all of the remaining benefits of the performance obligation. Typically, over-time revenue recognition is based on the utilization of the input measure of costs incurred to date relative to total estimated costs to measure progress. Throughout the life of a contract, this measure of progress captures the timing of our underlying technical performance activities (engineering design, customized material assembly, quality testing, and solution integration) which can fluctuate in the timing of delivering the customer's specifically designed solution versus the original project plans. Changes in total estimated costs are recognized using the cumulative catch-up method of accounting which recognize the cumulative effect of the changes on current and prior periods in the current period. Accordingly, the effect of the changes on future periods of contract performance is recognized as if the revised estimate had been the original estimate. Provisions for estimated losses on uncompleted contracts are made in the period in which such losses are first determined. A significant change in an estimate on one or more contracts could have a material effect on the Company’s consolidated financial position, results from operations, or cash flows. However, there were no significant changes in estimated contract costs for the years ended December 31, 2025, 2024, or 2023.
Service revenues (service-type warranty, post contract support, installation, and subscription-based services) are recognized over time as the customers receive and consume benefits of such services simultaneously.
Revenue derived from passive dosimetry and analytical services is of a subscription nature and is provided to customers on an agreed-upon recurring monthly, quarterly or annual basis. Services are provided to the customer via passive dosimeter badges that the Company supplies to customer personnel. Depending on the type of badge utilized, either customers return the used badges to the Company for analysis, or they obtain the analysis directly via a self-service web portal. The Company believes that badge production, badge wearing, badge analysis and report preparation are not individually distinct and therefore a single performance obligation recognized over time. Revenue is recognized ratably over the service period as the service is continuous, and no other discernible pattern of recognition is evident.
Performance Obligations Satisfied at a Point in Time:
If a performance obligation does not qualify for over-time revenue recognition, revenue is then recognized at the point-in-time in which control of the distinct good or service is transferred to the customer, typically based upon the terms of delivery. Where arrangements include customer acceptance provisions based on seller or customer-specified objective criteria, we recognize revenue when we have concluded that the customer has control of the equipment and that acceptance has occurred.
Contract Balances, Deferred Revenue and Customer Deposits
Revenue earned in excess of billings on contracts in progress (contract assets) are classified in the consolidated balance sheet in costs in excess of billings on uncompleted contracts. Amounts billed in excess of revenue earned (contract liabilities) are included in deferred contract revenue. Our billing terms for these over-time contracts are generally based on achieving specified milestones. The differences between the timing of our revenue recognized (based on costs incurred) and customer billings (based on contractual terms) results in changes to our contract asset or contract liability positions. Milestone billing is aligned to the timing of the associated performance of the Company at the contract onset and generally occurs multiple times in a given twelve month period. Unexpected project delays could impact the contract asset or liability position during the course of a contract. Contract asset balances are reviewed by management for future credit losses by considering factors such as historical experience, the customers' financial condition and current economic conditions. In circumstances where the Company is aware of a specific customer's inability to meet its financial and contractual obligations, a specific reserve is recorded against the contract asset. For more information, see Note 3, Contracts in Progress.
Deferred contract revenue also includes prepayments from customers, including milestone or installment payments, on projects for which services or products have commenced. For dosimetry and analytical services, many customers pay for these measuring and monitoring services in advance and these amounts are recorded as deferred contract revenue in the consolidated balance sheets, net of a reserve for estimated cancellations. Deferred revenue expected to be realized in excess of 12 months was $2.2 million and $3.0 million as of December 31, 2025 and 2024, respectively, and is included in Other Liabilities in the Consolidated Balance Sheets.
Customer deposits represent cash received for contracts in which product manufacturing or services have not commenced and the amounts received are fully refundable if the underlying good is not delivered. Customer deposits are recorded in Accrued expenses and other current liabilities in the Consolidated Balance Sheet.
56
Payment terms for shipments to end-users are generally net 30 days. Payment terms for distributor shipments may range from 30 to 90 days.
Remaining Performance Obligations
Remaining performance obligations represent committed but undelivered contracts and purchase orders at period end. Maintenance-related activity and agreements that do not represent firm purchase orders are not included in remaining performance obligations. Customer agreements that contain cancellation for convenience terms are not reflected until firm purchase orders are received. Contract modifications could affect both the timing to complete as well as the amount to be received as we fulfill the related remaining performance obligations. Expected timing of the satisfaction of performance obligations in our longer term projects can fluctuate due to changes such as procurement timing of specialized materials, engineering design changes, and changes in required technical work as determined in quality control testing.
The remaining performance obligations for all open contracts as of December 31, 2025 include assembly, delivery, installation, and trainings. The aggregate amount of the transaction price allocated to the remaining performance obligations for all open customer contracts was approximately $1,104.3 million and $811.9 million as of December 31, 2025 and December 31, 2024, respectively. As of December 31, 2025, the Company expects to recognize approximately 49%, 20%, 9%, and 6% of the remaining performance obligations as revenue during the fiscal years 2026, 2027, 2028 and 2029, respectively.
Disaggregation of Revenues
A disaggregation of the Company’s revenues by segment, geographic region, timing of revenue recognition, product category and market category is provided in Note 17, Segment Information.
Accounting for Income Taxes
The Company accounts for income taxes and the related accounts under the asset and liability method. Deferred tax assets and liabilities are recognized for the expected tax consequences of temporary differences between the tax bases of assets and liabilities and their reported amounts. Valuation allowances are recorded to reduce deferred tax assets to the amount that will more likely than not be realized. The Company classifies all deferred tax assets and liabilities, and any related valuation allowance, as non-current in the Consolidated Balance Sheets.
The Company accounts for uncertainty in income taxes using a two-step approach to recognizing and measuring uncertain tax positions. The first step is to evaluate the tax position for recognition by determining if the weight of available evidence indicates that it is more likely than not that the position will be sustained on audit, including resolution of related appeals or litigation processes, if any. The second step is to measure the tax benefit as the largest amount that is more than 50% likely of being realized upon settlement. The Company classifies the liability for unrecognized tax benefits as current in the balance sheet, to the extent that the Company anticipates payment or receipt of cash within one year. Interest and penalties related to uncertain tax positions are recognized in the provision for income taxes.
New Accounting Standards
See Note 1, Nature of Business and Summary of Significant Accounting Policies, included elsewhere in this Annual Report on Form 10-K for a full description of any recent accounting pronouncements, including the respective expected dates of adoption and expected effects on our results of operations and financial condition.
57
ITEM 7A. QUANTITATIVE AND QUALITATIVE DISCLOSURES ABOUT MARKET RISK
Quantitative and Qualitative Disclosures about Market Risk
Market risk
The market risk inherent in financial statements represents the potential loss in fair value, earnings or cash flows arising from adverse changes in foreign currency exchange rates, commodity prices or interest rates. We may use derivative financial instruments like interest rate swaps to manage exposure to market risks. We do not use derivative financial instruments for trading purposes.
Foreign currency exchange rate risk
In the normal course of business, we are exposed to changes in foreign currency exchange rates due to its worldwide presence and business profile. Foreign currency exposures relate to transactions denominated in currencies that differ from the functional currencies of our subsidiaries. We may from time to time use cross currency swap agreements or other hedging instruments to manage certain foreign currency exposures.
We derived approximately 43.2%, 42.1%, and 40.6% of our revenues during the years ended December 31, 2025, December 31, 2024, and December 31, 2023, respectively, from outside the United States through international operations, some of which were transacted in U.S. dollars. In addition, certain of our domestic operations have sales to foreign customers. Although we are impacted by the exchange rates of several currencies, our largest exposures are generally to the Euro, Canadian dollar, British Pound, and Japanese Yen. In conducting our foreign operations, we also make inter-company sales denominated in different currencies. These activities expose us to the effect of changes in foreign currency exchange rates. Flows of foreign currencies into and out of our operations are generally stable, regularly occurring and are recorded at fair market value in our financial statements.
During the year ended December 31, 2025, the effect of a hypothetical 10% change in foreign currencies that we have exposure to compared to the U.S. dollar would have impacted our revenues by approximately $39.0 million. As of the year ended December 31, 2025, if foreign exchange rates changed by 10%, the market value of our cross-currency rate swaps would change approximately $25.0 million.
During the year ended December 31, 2025, the eff7ect of a hypothetical 1% change in exchange rates would have impacted accumulated other comprehensive income by approximately $24.7 million. This impact does not consider the effects of a stronger or weaker dollar on our ability to compete for export business or the overall economic activity that could exist in such an environment. Changes in foreign exchange rates could impact the price and the demand for our products such as a strengthening dollar causes exports to become more expensive to foreign customers and businesses that must pay for them in other currencies.
Interest rates risk
We are exposed to changes in interest rates primarily as a result of our long-term debt. We may from time to time use interest rate swap agreements or other hedging instruments to manage the interest rate characteristics of a portion of our outstanding debt. In the year ended December 31, 2023, we executed an interest rate swap agreement effective June 30, 2023 through June 30, 2026, which entitles the Company to floating interest receipts for fixed interest payments on $75.0 million notional value. In the year ended December 31, 2025, we executed an interest rate swap agreement effective June 30, 2025 through December 31, 2026 which entitles the Company to floating interest receipts for fixed payments on $100.0 million notional value. Based on the amounts and mix of our floating rate debt at December 31, 2025, if market interest rates increase an average of 100 basis points, our year-to-date interest expense would change by approximately $5.2 million and our interest rate swaps market value would change by approximately $1.0 million. We determined these amounts by considering the impact of the hypothetical interest rates on our borrowing costs. This analysis does not consider the effects of changes in the level of overall economic activity that could exist in such an environment.
58
ITEM 8. FINANCIAL STATEMENTS AND SUPPLEMENTARY DATA
INDEX TO CONSOLIDATED FINANCIAL STATEMENTS
Report of Independent Registered Public Accounting Firm (Deloitte & Touche LLP, Atlanta, GA, PCAOB ID No. | |||||
as of December 31, 2025 and December 31, 2024 | |||||
for the fiscal year ended December 31, 2025, December 31, 2024, and December 31, 2023 | |||||
for the fiscal year ended December 31, 2025, December 31, 2024, and December 31, 2023 | |||||
for the fiscal year ended December 31, 2025, December 31, 2024, and December 31, 2023 | |||||
for the fiscal year ended December 31, 2025, December 31, 2024, and December 31, 2023 | |||||
59
REPORT OF INDEPENDENT REGISTERED PUBLIC ACCOUNTING FIRM
To the shareholders and the Board of Directors of Mirion Technologies, Inc.
Opinion on the Financial Statements
We have audited the accompanying consolidated balance sheets of Mirion Technologies, Inc. and subsidiaries (the "Company") as of December 31, 2025 and December 31, 2024, the related consolidated statements of operations, comprehensive income (loss), stockholders' equity, and cash flows, for each of the three years in the period ended December 31, 2025, and the related notes and the schedules listed in the Index at Item 15 (collectively referred to as the "financial statements"). In our opinion, the financial statements present fairly, in all material respects, the financial position of the Company as of December 31, 2025 and December 31, 2024, and the results of its operations and its cash flows for each of the three years in the period ended December 31, 2025, in conformity with accounting principles generally accepted in the United States of America.
We have also audited, in accordance with the standards of the Public Company Accounting Oversight Board (United States) (PCAOB), the Company's internal control over financial reporting as of December 31, 2025, based on criteria established in Internal Control — Integrated Framework (2013) issued by the Committee of Sponsoring Organizations of the Treadway Commission and our report dated February 19, 2026, expressed an unqualified opinion on the Company's internal control over financial reporting.
Basis for Opinion
These financial statements are the responsibility of the Company's management. Our responsibility is to express an opinion on the Company's financial statements based on our audits. We are a public accounting firm registered with the PCAOB and are required to be independent with respect to the Company in accordance with the U.S. federal securities laws and the applicable rules and regulations of the Securities and Exchange Commission and the PCAOB.
We conducted our audits in accordance with the standards of the PCAOB. Those standards require that we plan and perform the audit to obtain reasonable assurance about whether the financial statements are free of material misstatement, whether due to error or fraud. Our audits included performing procedures to assess the risks of material misstatement of the financial statements, whether due to error or fraud, and performing procedures that respond to those risks. Such procedures included examining, on a test basis, evidence regarding the amounts and disclosures in the financial statements. Our audits also included evaluating the accounting principles used and significant estimates made by management, as well as evaluating the overall presentation of the financial statements. We believe that our audits provide a reasonable basis for our opinion.
Critical Audit Matter
The critical audit matters communicated below are matters arising from the current-period audit of the financial statements that were communicated or required to be communicated to the audit committee and that (1) relate to accounts or disclosures that are material to the financial statements and (2) involved our especially challenging, subjective, or complex judgments. The communication of critical audit matters does not alter in any way our opinion on the financial statements, taken as a whole, and we are not, by communicating the critical audit matters below, providing separate opinions on the critical audit matters or on the accounts or disclosures to which they relate.
Contracts in Progress - Refer to Notes 1 and 3 to the financial statements
Critical Audit Matter Description
The Company recognizes revenue from certain contracts that involve customization of equipment to customer specifications using a percentage-of-completion method measured on the cost-to-cost basis, because transfer of control to the customer is continuous. The accounting for these contracts involves judgment, particularly as it relates to the process of estimating total costs for the performance obligation. The Company uses costs incurred in the input method to determine progress, and revenue is recognized based on costs incurred to date plus the estimate of the margin at completion.
Given the judgments necessary to estimate total costs to complete for certain fixed-price contracts that involve customization of equipment, auditing such estimates required extensive audit effort due to the subjectivity of cost to complete estimates and a high degree of auditor judgment when performing audit procedures and evaluating the results of those procedures.
60
How the Critical Audit Matter Was Addressed in the Audit
Our audit procedures related to Contracts in Progress included the following, among others:
•We tested the effectiveness of controls over revenue contracts recognized over time, including management's controls over the estimates of total costs at completion.
•We selected a sample of fixed-price contracts that involve customization of equipment and performed the following:
◦Evaluated whether the contracts were properly included in management’s calculation of percentage-of-completion revenue based on the terms and conditions of each contract, including whether continuous transfer of control to the customer occurred as progress was made toward fulfilling the performance obligation.
◦Compared the transaction prices to the consideration expected to be received based on current rights and obligations under the contracts and any modifications that were agreed upon with the customers.
◦Tested management’s identification of distinct performance obligations by evaluating whether the underlying goods, services, or both were highly interdependent and interrelated.
◦Tested the accuracy and completeness of the costs incurred to date for the performance obligation.
◦Evaluated the estimates of total cost by:
▪Comparing the expected total cost to previous estimates of expected total cost to identify potential bias in estimates.
▪Evaluating management’s ability to achieve the estimates of total cost and profit by performing corroborating inquiries with the Company’s project managers and engineers and comparing the estimates to engineering specifications.
▪Comparing management’s estimates of cost for certain labor and material inputs to salary information and vendor invoices or vendor quotes, when applicable.
•Tested the mathematical accuracy of management's calculation of revenue for the performance obligation.
•We evaluated management’s ability to estimate total costs accurately by evaluating significant fluctuations in margins year over year on percentage-of-completion contracts.
/s/ DELOITTE & TOUCHE LLP
February 19, 2026
We have served as the Company's auditor since 2015.
61
Mirion Technologies, Inc.
Consolidated Balance Sheets
(In millions, except share data)
| December 31, 2025 | December 31, 2024 | ||||||||||
| ASSETS | |||||||||||
| Current assets: | |||||||||||
| Cash and cash equivalents | $ | $ | |||||||||
| Accounts receivable, net of allowance for doubtful accounts | |||||||||||
| Costs in excess of billings on uncompleted contracts | |||||||||||
| Inventories | |||||||||||
| Prepaid expenses and other current assets | |||||||||||
| Total current assets | |||||||||||
| Property, plant, and equipment, net | |||||||||||
| Operating lease right-of-use assets | |||||||||||
| Goodwill | |||||||||||
| Intangible assets, net | |||||||||||
| Other assets | |||||||||||
| Total assets | $ | $ | |||||||||
| LIABILITIES AND STOCKHOLDERS’ EQUITY | |||||||||||
| Current liabilities: | |||||||||||
| Accounts payable | $ | $ | |||||||||
| Deferred contract revenue | |||||||||||
| Debt, current | |||||||||||
| Operating lease liability, current | |||||||||||
| Derivative liabilities, current | |||||||||||
| Accrued expenses and other current liabilities | |||||||||||
| Total current liabilities | |||||||||||
| Debt, non-current | |||||||||||
| Convertible debt | |||||||||||
| Operating lease liability, non-current | |||||||||||
| Deferred income taxes, non-current | |||||||||||
| Other liabilities | |||||||||||
| Total liabilities | |||||||||||
| Commitments and contingencies (Note 11) | |||||||||||
Stockholders’ equity: | |||||||||||
Class A common stock; $ | |||||||||||
Class B common stock; $ | |||||||||||
Treasury stock, at cost; | ( | ( | |||||||||
| Additional paid-in capital | |||||||||||
| Accumulated deficit | ( | ( | |||||||||
| Accumulated other comprehensive loss | ( | ( | |||||||||
Mirion Technologies, Inc. stockholders’ equity | |||||||||||
| Noncontrolling interests | |||||||||||
| Total stockholders’ equity | |||||||||||
| Total liabilities and stockholders’ equity | $ | $ | |||||||||
The accompanying notes are an integral part of these consolidated financial statements.
62
Mirion Technologies, Inc.
Consolidated Statements of Operations
(In millions, except per share data)
Fiscal Year Ended December 31, 2025 | Fiscal Year Ended December 31, 2024 | Fiscal Year Ended December 31, 2023 | |||||||||||||||
| Revenues: | |||||||||||||||||
| Product | $ | $ | $ | ||||||||||||||
| Service | |||||||||||||||||
| Total revenues | |||||||||||||||||
| Cost of revenues: | |||||||||||||||||
| Product | |||||||||||||||||
| Service | |||||||||||||||||
| Total cost of revenues | |||||||||||||||||
| Gross profit | |||||||||||||||||
| Operating expenses: | |||||||||||||||||
| Selling, general and administrative | |||||||||||||||||
| Research and development | |||||||||||||||||
| (Gain) loss on disposal of business | ( | ||||||||||||||||
| Total operating expenses | |||||||||||||||||
| Income (loss) from operations | ( | ||||||||||||||||
| Other expense (income): | |||||||||||||||||
| Interest expense | |||||||||||||||||
| Interest income | ( | ( | ( | ||||||||||||||
| Loss on debt extinguishment | |||||||||||||||||
| Foreign currency (gain) loss, net | ( | ( | |||||||||||||||
| Increase in fair value of warrant liabilities | |||||||||||||||||
| Other expense (income), net | ( | ( | |||||||||||||||
| Income (loss) before income taxes | ( | ( | |||||||||||||||
| Income tax expense (benefit) | ( | ||||||||||||||||
| Net income (loss) | ( | ( | |||||||||||||||
| Income (loss) attributable to noncontrolling interests | ( | ( | |||||||||||||||
| Net income (loss) attributable to Mirion Technologies, Inc. | $ | $ | ( | $ | ( | ||||||||||||
| Earnings (loss) per common share attributable to Mirion Technologies, Inc.: | |||||||||||||||||
| Basic | $ | $ | ( | $ | ( | ||||||||||||
| Diluted | $ | $ | ( | $ | ( | ||||||||||||
| Weighted average common shares outstanding: | |||||||||||||||||
| Basic | |||||||||||||||||
| Diluted | |||||||||||||||||
The accompanying notes are an integral part of these consolidated financial statements.
63
Mirion Technologies, Inc.
Consolidated Statements of Comprehensive Income (Loss)
(In millions)
Fiscal Year Ended December 31, 2025 | Fiscal Year Ended December 31, 2024 | Fiscal Year Ended December 31, 2023 | |||||||||||||||
| Net income (loss) | $ | $ | ( | $ | ( | ||||||||||||
| Other comprehensive income (loss), net of tax: | |||||||||||||||||
| Foreign currency translation gain (loss), net of tax | ( | ||||||||||||||||
| Unrecognized actuarial gain (loss) and prior service benefit, net of tax | ( | ||||||||||||||||
| Unrealized (loss) gain on net investment hedges, net of tax | ( | ( | |||||||||||||||
| Unrealized (loss) gain on cash flow hedges, net of tax | ( | ||||||||||||||||
| Other comprehensive income (loss), net of tax | ( | ||||||||||||||||
| Comprehensive income (loss) | ( | ( | |||||||||||||||
| Less: Comprehensive income (loss) attributable to noncontrolling interests | ( | ( | |||||||||||||||
| Comprehensive income (loss) attributable to Mirion Technologies, Inc. | $ | $ | ( | $ | ( | ||||||||||||
The accompanying notes are an integral part of these consolidated financial statements.
64
Mirion Technologies, Inc.
Consolidated Statements of Stockholders’ Equity
(In millions, except share amounts)
| Class A Common Stock | Class B Common Stock | Treasury Stock | |||||||||||||||||||||||||||||||||||||||||||||||||||||||||||||||
| Shares | Amount | Shares | Amount | Shares | Amount | Additional Paid-In Capital | Accumulated Deficit | Accumulated Other Comprehensive Income (Loss) | Noncontrolling Interests | Total Stockholders’ Equity | |||||||||||||||||||||||||||||||||||||||||||||||||||||||
| Balance December 31, 2022 | $ | $ | $ | $ | $ | ( | $ | ( | $ | $ | |||||||||||||||||||||||||||||||||||||||||||||||||||||||
| Warrant redemptions | — | — | — | — | — | — | — | — | — | — | |||||||||||||||||||||||||||||||||||||||||||||||||||||||
| Stock issued for vested restricted stock units | — | — | — | — | — | — | — | — | — | — | |||||||||||||||||||||||||||||||||||||||||||||||||||||||
| Shares repurchased to satisfy tax withholdings for vesting restricted stock units | ( | — | ( | ( | |||||||||||||||||||||||||||||||||||||||||||||||||||||||||||||
| Stock compensation to directors in lieu of cash compensation | — | — | — | — | — | — | — | — | |||||||||||||||||||||||||||||||||||||||||||||||||||||||||
| Conversion of shares of class B common stock to class A common stock | — | ( | — | — | — | — | — | ( | — | ||||||||||||||||||||||||||||||||||||||||||||||||||||||||
| Issuance of shares of class A common stock under a direct registered offering, net of offering costs | — | — | — | — | — | — | — | — | |||||||||||||||||||||||||||||||||||||||||||||||||||||||||
| Stock-based compensation expense | — | — | — | — | — | — | — | — | |||||||||||||||||||||||||||||||||||||||||||||||||||||||||
| Net loss | — | — | — | — | — | — | — | ( | — | ( | ( | ||||||||||||||||||||||||||||||||||||||||||||||||||||||
| Other comprehensive income (loss) | — | — | — | — | — | — | — | — | |||||||||||||||||||||||||||||||||||||||||||||||||||||||||
| Balance December 31, 2023 | $ | $ | $ | ( | $ | $ | ( | $ | ( | $ | $ | ||||||||||||||||||||||||||||||||||||||||||||||||||||||
| Public warrants exercises | — | — | — | — | — | — | — | — | |||||||||||||||||||||||||||||||||||||||||||||||||||||||||
| Private warrants exchange | — | — | — | — | — | — | — | — | |||||||||||||||||||||||||||||||||||||||||||||||||||||||||
| Stock issued for vested restricted stock units | — | — | — | — | — | — | — | — | — | — | |||||||||||||||||||||||||||||||||||||||||||||||||||||||
| Shares repurchased to satisfy tax withholdings for vesting restricted stock units | ( | — | — | — | ( | — | — | — | — | ( | |||||||||||||||||||||||||||||||||||||||||||||||||||||||
| Stock compensation to directors in lieu of cash compensation | — | — | — | — | — | — | — | — | |||||||||||||||||||||||||||||||||||||||||||||||||||||||||
| Conversion of shares of class B common stock to class A common stock | — | ( | — | — | — | — | — | ( | |||||||||||||||||||||||||||||||||||||||||||||||||||||||||
| Stock-based compensation expense | — | — | — | — | — | — | — | — | — | ||||||||||||||||||||||||||||||||||||||||||||||||||||||||
| Net loss | — | — | — | — | — | — | — | ( | — | ( | ( | ||||||||||||||||||||||||||||||||||||||||||||||||||||||
| Other comprehensive income (loss) | — | — | — | — | — | — | — | — | ( | ( | ( | ||||||||||||||||||||||||||||||||||||||||||||||||||||||
| Balance December 31, 2024 | $ | $ | $ | ( | $ | $ | ( | $ | ( | $ | $ | ||||||||||||||||||||||||||||||||||||||||||||||||||||||
65
| Class A Common Stock | Class B Common Stock | Treasury Stock | |||||||||||||||||||||||||||||||||||||||||||||||||||||||||||||||
| Shares | Amount | Shares | Amount | Shares | Amount | Additional Paid-In Capital | Accumulated Deficit | Accumulated Other Comprehensive Income (Loss) | Noncontrolling Interests | Total Stockholders’ Equity | |||||||||||||||||||||||||||||||||||||||||||||||||||||||
| Stock issued for vested restricted stock units | — | — | — | — | — | — | — | — | — | — | |||||||||||||||||||||||||||||||||||||||||||||||||||||||
| Stock issued from treasury stock for vested restricted stock units | — | — | — | ( | ( | — | — | — | |||||||||||||||||||||||||||||||||||||||||||||||||||||||||
| Shares repurchased to satisfy tax withholdings for vesting restricted stock units | ( | — | — | — | ( | — | — | — | — | ( | |||||||||||||||||||||||||||||||||||||||||||||||||||||||
| Stock compensation to directors in lieu of cash compensation | — | — | — | — | — | — | — | — | |||||||||||||||||||||||||||||||||||||||||||||||||||||||||
| Conversion of shares of class B common stock to class A common stock | — | ( | — | — | — | — | — | ( | |||||||||||||||||||||||||||||||||||||||||||||||||||||||||
| Issuance of shares of class A common stock under a direct registered offering, net of offering costs | — | — | — | — | — | — | — | — | |||||||||||||||||||||||||||||||||||||||||||||||||||||||||
| Purchases of treasury stock | ( | — | — | — | ( | — | — | — | — | ( | |||||||||||||||||||||||||||||||||||||||||||||||||||||||
| Purchases of capped calls related to convertible debt, net of tax | — | — | — | — | — | — | ( | — | — | — | ( | ||||||||||||||||||||||||||||||||||||||||||||||||||||||
| Tax impact of capped calls related to convertible debt | — | — | — | — | — | — | ( | — | — | — | ( | ||||||||||||||||||||||||||||||||||||||||||||||||||||||
| Stock-based compensation expense | — | — | — | — | — | — | — | — | — | ||||||||||||||||||||||||||||||||||||||||||||||||||||||||
| Net income | — | — | — | — | — | — | — | — | |||||||||||||||||||||||||||||||||||||||||||||||||||||||||
| Other comprehensive income (loss) | — | — | — | — | — | — | — | — | |||||||||||||||||||||||||||||||||||||||||||||||||||||||||
| Balance December 31, 2025 | $ | $ | $ | ( | $ | $ | ( | $ | ( | $ | $ | ||||||||||||||||||||||||||||||||||||||||||||||||||||||
The accompanying notes are an integral part of these consolidated financial statements.
66
Mirion Technologies, Inc.
Consolidated Statements of Cash Flows
(In millions)
Fiscal Year Ended December 31, 2025 | Fiscal Year Ended December 31, 2024 | Fiscal Year Ended December 31, 2023 | |||||||||||||||
| OPERATING ACTIVITIES: | |||||||||||||||||
| Net income (loss) | $ | $ | ( | $ | ( | ||||||||||||
| Adjustments to reconcile net income (loss) to net cash provided by operating activities: | |||||||||||||||||
| Depreciation and amortization expense | |||||||||||||||||
| Stock-based compensation expense | |||||||||||||||||
| Loss on debt extinguishment | |||||||||||||||||
| Amortization of debt issuance costs | |||||||||||||||||
| Provision for doubtful accounts | |||||||||||||||||
| Inventory obsolescence write down | |||||||||||||||||
| Change in deferred income taxes | ( | ( | ( | ||||||||||||||
| Loss on disposal of property, plant and equipment and badges | |||||||||||||||||
| (Gain) loss on foreign currency transactions | ( | ( | |||||||||||||||
| Increase in fair values of warrant liabilities | |||||||||||||||||
| (Gain) loss on disposal of business | ( | ||||||||||||||||
| Other | ( | ||||||||||||||||
| Changes in operating assets and liabilities: | |||||||||||||||||
| Accounts receivable | ( | ( | |||||||||||||||
| Costs in excess of billings on uncompleted contracts | ( | ( | |||||||||||||||
| Inventories | ( | ||||||||||||||||
| Deferred cost of revenue | ( | ||||||||||||||||
| Prepaid expenses and other current assets | ( | ( | ( | ||||||||||||||
| Accounts payable | ( | ( | ( | ||||||||||||||
| Accrued expenses and other current liabilities | ( | ||||||||||||||||
| Deferred contract revenue | ( | ( | |||||||||||||||
| Other assets | ( | ||||||||||||||||
| Other liabilities | ( | ( | |||||||||||||||
| Net cash provided by operating activities | |||||||||||||||||
| INVESTING ACTIVITIES: | |||||||||||||||||
| Acquisitions of businesses, net of cash and cash equivalents acquired | ( | ( | ( | ||||||||||||||
| Proceeds from disposal of property, plant, and equipment and badges | |||||||||||||||||
| Purchases of property, plant, and equipment and badges | ( | ( | ( | ||||||||||||||
| Proceeds from net investment hedge derivative contracts | |||||||||||||||||
| Proceeds from business disposal | |||||||||||||||||
| Other investing | ( | ||||||||||||||||
| Net cash used in investing activities | ( | ( | ( | ||||||||||||||
| FINANCING ACTIVITIES: | |||||||||||||||||
| Issuances of common stock | |||||||||||||||||
| Common stock issuance costs | ( | ( | |||||||||||||||
| Stock repurchased to satisfy tax withholding for vesting restricted stock units | ( | ( | ( | ||||||||||||||
| Purchases of stock for treasury | ( | ||||||||||||||||
| Proceeds from issuance of convertible senior notes, net of bank costs | |||||||||||||||||
| Third-party issuance costs for convertible senior notes | ( | ||||||||||||||||
| Purchase of capped calls related to convertible senior notes | ( | ||||||||||||||||
| Term loan principal repayments | ( | ( | |||||||||||||||
| Financing costs | ( | ( | |||||||||||||||
| Proceeds from cash flow hedge derivative contracts | |||||||||||||||||
| Other financing | ( | ( | |||||||||||||||
| Net cash provided by (used in) financing activities | ( | ||||||||||||||||
| Effect of exchange rate changes on cash, cash equivalents, and restricted cash | ( | ||||||||||||||||
| Net increase in cash, cash equivalents, and restricted cash | |||||||||||||||||
| Cash, cash equivalents, and restricted cash at beginning of period | |||||||||||||||||
| Cash, cash equivalents, and restricted cash at end of period | $ | $ | $ | ||||||||||||||
The accompanying notes are an integral part of these consolidated financial statements.
67
Mirion Technologies, Inc.
Notes to Consolidated Financial Statements
1. Nature of Business and Summary of Significant Accounting Policies
Nature of Business
Mirion Technologies, Inc. (“Mirion,” the “Company,” "we," "our," or "us") is a global provider of radiation detection, measurement, analysis, and monitoring products and services to the medical, nuclear, and defense end markets. The Company provides products and services through two
The Company is headquartered in Atlanta, Georgia and has operations in the United States, Canada, the United Kingdom, France, Germany, Finland, China, Belgium, the Netherlands, Estonia, Japan, and South Korea.
Basis of Presentation and Principles of Consolidation
The accompanying Consolidated Financial Statements and notes to Consolidated Financial Statements have been prepared in accordance with accounting principles generally accepted in the United States of America (“GAAP”) for financial statements and pursuant to the accounting and disclosure rules and regulations of the U.S. Securities and Exchange Commission (the "SEC"). The Consolidated Financial Statements include the accounts of the Company and its wholly owned and majority-owned or controlled subsidiaries. For consolidated subsidiaries where our ownership is less than 100%, the portion of the net income or loss allocable to noncontrolling interests is reported as “Income (Loss) attributable to noncontrolling interests” in the Consolidated Statements of Operations. All intercompany accounts and transactions have been eliminated in consolidation.
Segments
Use of Estimates
68
Cash and Cash Equivalents
The Company considers all cash on deposit and money market accounts purchased with original maturities of three months or less to be cash and cash equivalents. Cash equivalents primarily consist of amounts held in interest-bearing money market accounts that are readily convertible to cash.
The Company maintains cash in bank deposit accounts that, at times, may exceed the insured limits of the local country, which may lead to a concentration of credit risk. Substantially all of the Company’s cash and cash equivalent balances were deposited with financial institutions which management has determined to be high-credit quality institutions. The Company has not experienced any losses in such accounts.
Accounts Receivable and Allowance for Doubtful Accounts
Accounts receivable are recorded at the invoiced amount and do not bear interest. The allowance for doubtful accounts represents management's best estimate of the expected future credit losses from the Company's trade accounts. Determination of the allowances requires management to exercise judgment about the timing, frequency and severity of credit losses that could materially effect the provision. The Company performs detailed reviews by considering factors such as historical experience, the customers' financial condition, credit quality, the age of the accounts receivable balances and current economic conditions that may affect a customer’s ability to pay. In circumstances where the Company is aware of a specific customer's inability to meet its financial obligations, a specific reserve is recorded against the amounts due.
Inventories
Inventories are stated at the lower of cost or net realizable value. Cost is computed using actual costs or standard costs that approximate actual cost, determined on a first-in, first-out basis. A portion of the inventory relates to evaluation units located at customer locations to facilitate customer tests prior to purchasing. Inventories also include completed products and in-process customer projects for which the related revenue has been deferred pending delivery, completion of services or determination that all customer-specific acceptance criteria have been met. Inventory in excess of expected future demand or obsolete inventory is written down to its estimated realizable value based on future demand forecasts and historical demand trends.
Prepaid Expenses and Other Current Assets
The components of prepaid expenses and other current assets consist of the following (in millions):
| December 31, 2025 | December 31, 2024 | ||||||||||
| Prepaid insurance | $ | $ | |||||||||
| Prepaid vendor deposits | |||||||||||
| Prepaid software expenses | |||||||||||
| Restricted Cash | |||||||||||
| Short-term marketable securities | |||||||||||
| Income tax receivable and prepaid income taxes | |||||||||||
| Other tax receivables | |||||||||||
| Other current assets | |||||||||||
| $ | $ | ||||||||||
69
Lease Assets
The Company leases certain logistics, office, and manufacturing facilities, as well as vehicles, copiers and other equipment. We record our operating lease right of use ("ROU") assets and liabilities at the commencement date of the lease based on the present value of lease payments over the lease term.
ROU assets represent our right to use an underlying asset for the lease term and lease liabilities represent our obligation to make lease payments arising from the lease. Our leases may include options to extend or terminate the lease. These options to extend are included in the lease term when it is reasonably certain that we will exercise that option. While some leases provide for variable payments, they are not included in the ROU assets and liabilities because they are not based on an index or rate. Variable payments for real estate leases primarily relate to common area maintenance, insurance, taxes and utilities. Variable payments for equipment, vehicles and leases within supply agreements primarily relate to usage, repairs, and maintenance. As the implicit rate is not readily determinable for our leases, we apply a portfolio approach using an estimated incremental borrowing rate to determine the initial present value of lease payments over the lease terms on a collateralized basis over a similar term, which is based on market and company specific information. We use the unsecured borrowing rate and risk-adjust that rate to approximate a collateralized rate, and apply the rate based on the currency of the lease, which is updated on a quarterly basis for measurement of new lease liabilities.
We have made an accounting policy election to not recognize ROU assets and liability for leases with a term of 12 months or less unless the lease includes an option to renew or purchase the underlying asset that are reasonably certain to be exercised. In addition, the Company has applied the practical expedient to account for the lease and non-lease components as a single lease component for all of the Company's leases.
See Note 10, Leased Assets for additional details.
Property, Plant, and Equipment
Property, plant, and equipment are carried at cost, net of accumulated depreciation and amortization. Property, plant and equipment acquired through the acquisition of a business are recorded at their estimated fair value at the date of acquisition. Depreciation is computed when an asset is placed into service using the straight-line method over the estimated useful life of the asset. Leasehold improvements are amortized using the straight-line method over the shorter of the related lease term or the estimated useful life of the improvements. Development costs related to internal-use software are amortized using the straight-line method over the shorter of the software license or the estimated useful life of the software. Repair and maintenance costs are expensed as incurred.
Estimated useful lives are periodically reviewed and, when appropriate, changes to estimates are made prospectively. When certain events or changes in operating conditions occur, asset lives may be adjusted, and an impairment assessment may be performed on the recoverability of the carrying amounts. Refer to Note 5, Property, Plant and Equipment, Net, for disclosure of estimated useful lives.
When property, plant equipment is retired or otherwise disposed of, the cost and related accumulated depreciation are removed from the balance sheet. Any difference between the net asset value and the proceeds on sale are charged or credited to income.
Business Combinations
We account for business acquisitions in accordance with ASC 805, "Business Combinations." This standard requires the acquiring entity in a business combination to recognize all the assets acquired and liabilities assumed in the transaction and establishes the acquisition date fair value as the measurement objective for all assets acquired and liabilities assumed in a business combination. Certain provisions of this standard prescribe, among other things, the determination of acquisition date fair value of consideration paid in a business combination (including contingent consideration) and the exclusion of transaction and acquisition-related restructuring costs from acquisition accounting.
The determination of the fair value of assets acquired and liabilities assumed involves assessments of factors such as the expected future cash flows associated with individual assets and liabilities and appropriate discount rates at the closing date of the acquisition. For non-observable market values, the Company determines fair value using acceptable valuation principles (e.g., multiple excess earnings, relief from royalty and cost methods).
Results of operations for acquired companies are included in our consolidated results of operations from the date of acquisition.
70
Goodwill
Goodwill represents the excess of the purchase price paid over the estimated fair value of the net assets acquired and liabilities assumed in the acquisition of a business.
Goodwill has an indefinite useful life, and is not amortized, but instead tested for impairment annually as of October 1 or more often if events or changes in circumstances indicate that the carrying amount may exceed fair value as set forth in ASC 350, “Intangibles — Goodwill and Other.” The Company tests for goodwill impairment at the reporting unit level, which is an operating segment or one level below an operating segment. The amount of goodwill acquired in a business combination that is assigned to one or more reporting units as of the acquisition date is the excess of the purchase price of the acquired businesses (or portion thereof) included in the reporting unit, over the fair value assigned to the individual assets acquired or liabilities assumed from a market participant perspective. Goodwill is assigned to the reporting unit(s) expected to benefit from the synergies of the combination even though other assets or liabilities of the acquired entity may not be assigned to that reporting unit.
ASC 350 allows an optional qualitative assessment ("Step 0") as part of annual impairment testing, prior to a quantitative assessment test, to determine whether it is more likely than not that the fair value of a reporting unit exceeds its carrying amount. If a qualitative assessment determines an impairment is more likely than not, the Company is required to perform a quantitative impairment test ("Step 1"). Otherwise, no further analysis is required. Alternatively, the Company may elect to proceed directly to the quantitative impairment test.
In conducting a qualitative assessment, the Company analyzes actual and projected growth trends for net sales and margin for each reporting unit, as well as historical performance versus plan and the results of prior quantitative tests performed. Additionally, the Company assesses factors that may impact its business, including macroeconomic conditions and the related impact, market-related exposures, plans to market for sale all or a portion of the business, competitive changes, new or discontinued product lines, changes in key personnel, and any potential risks to projected financial results.
If performed, the quantitative test compares the fair value of a reporting unit with its carrying amount. We determine the fair value of each reporting unit by estimating the present value of expected future cash flows, discounted by the applicable discount rate, and/or peer company multiples. If the carrying value exceeds the fair value, the Company recognizes an impairment loss in the amount equal to the excess, not to exceed the total amount of goodwill allocated to that reporting unit.
Intangible Assets
Intangible assets relate to the value associated with our developed technology, customer relationships, remaining performance obligations, and trade names at the time of acquisition through business combinations.
The Company determined the fair value of intangible assets acquired through an income approach, using the excess earnings method for customer relationships and remaining performance obligations. Under the excess earnings method, an intangible asset’s fair value is equal to the present value of the incremental after-tax cash flows attributable solely to the intangible asset over its remaining useful life. The relief from royalty method was used to determine the fair value of developed technology and trade name. The valuation models were based on estimates of future operating projections of the acquired business and rights to sell products as well as judgments on the discount rates used and other variables. We determined the forecasts based on a number of factors, including our best estimate of near-term net sales expectations and long-term projections, which include review of internal and independent market analyses. The discount rate used was representative of the weighted average cost of capital.
The customer relationships definite lived intangible assets are amortized either using the double declining balance method or on a straight-line basis with estimated useful lives ranging from 6 to 13 years, while all other definite lived intangible assets are amortized on a straight-line basis over their estimated useful lives, ranging from 5 to 16 years for developed technology and 1 to 10 years for trade names and other. The Company regularly evaluates the amortization period assigned
71
Impairment of Long-Lived Assets
Facility and Equipment Decommissioning Liabilities
The Company has asset retirement obligations (“ARO”) consisting primarily of equipment and facility decommissioning costs. The estimated fair value of these ARO liabilities is recognized in the period in which the liability is generated and a corresponding increase to the carrying value of the related asset is recorded and depreciated over the useful life of the asset. The Company’s estimates of its ultimate AROs could change because of changes in regulations, the extent of environmental remediation required, the means of reclamation, cost estimates, exit or disposal activities or time period estimates.
ARO liabilities totaled $2.9 million and $3.1 million at December 31, 2025 and December 31, 2024, respectively, and were included in Other liabilities in the consolidated balance sheets. Accretion expense related to these liabilities was not material for any periods presented.
Product Warranty
The Company offers warranties against material defects for most of its products for a specified time period, usually to twenty-four months from delivery or acceptance. When the related revenues are recognized, the Company provides for the estimated future costs of warranty obligations in cost of revenues. The accrued warranty costs represent the Company’s best estimate at the time of sale of the total costs that will be incurred to repair or replace product parts that fail while still under warranty.
The amount of the accrued estimated warranty cost obligations for established products is based on historical experience as to product failures adjusted for current information on repair costs. For new products, estimates include the historical experience of similar products, as well as a reasonable allowance for warranty expenses associated with the new products. On a quarterly basis, the Company reviews the accrued warranty costs and updates the historical warranty cost trends, if required.
Warrant Liability
During the fiscal year ended December 31, 2024, all warrants were exercised, redeemed, or exchanged for shares of Mirion Class A common stock or cash.
As of December 31, 2023, the Company had outstanding warrants to purchase up to 27,249,779 shares of Class A common stock. The Company accounted for the warrants in accordance with the guidance contained in ASC 815, “Derivatives and Hedging”, under which the warrants do not meet the criteria for equity treatment and must be recorded as derivative liabilities. Accordingly, the Company classified the warrants as liabilities at their fair value and adjusts the warrants to fair value at each reporting period. This liability was subject to re-measurement at each balance sheet date until the warrants were exercised, exchanged, or redeemed, and any change in fair value was recognized in the Company’s consolidated statements of operations. The fair value of the warrants (the "Public Warrants") was measured based on the listed market price of such Public Warrants. As the transfer of certain warrants issued in a private placement (the "Private Placement Warrants") to anyone who was not a permitted transferee would result in the Private Placement Warrants having substantially the same terms as the Public Warrants, we determined that the fair value of each Private Placement Warrant was equivalent to that of each Public Warrant. See Note 18, Fair Value Measurements.
On April 18, 2024, the Company called the Public Warrants for redemption per the Company's rights under the warrant agreement. After April 18, 2024 and prior to 5:00 pm New York City time on Monday, May 20, 2024 (the "Redemption Date"), Public Warrant holders were entitled to exercise (i) in cash, at an exercise price of $11.50 per share of Class A common stock, or (ii) on a cashless basis in which the exercising holder was entitled to receive 0.22 shares of Class A
72
common stock per Warrant. The number of shares provided to the warrant holder was determined in accordance with the terms of the warrant agreement, whereby the number of shares received in a cashless exercise was based upon the Redemption Date and the average last reported sale price of Class A common stock for the 10 trading days ending on the third trading day prior to the notice of Redemption Date. The Public Warrants were valued using the listed trading price as of close on the trading day prior to the relevant settlement date of exercise. Any Warrants not exercised by the Redemption Date were automatically redeemed by the Company at a price of $0.10 per Warrant. In connection with the Redemption, approximately 18,076,416 Public Warrants were exercised, representing approximately 96 % of the outstanding Public Warrants, and 3,978,418 shares of Class A common stock were issued upon exercise of such Warrants. Total cash proceeds generated from exercises of the Public Warrants were immaterial, and the Company made an immaterial redemption payment to the holders of the 673,363 redeemed Public Warrants. Following the Redemption Date, the Public Warrants stopped trading on NYSE and were delisted. No
On June 4, 2024, the Company exchanged 1,768,000 shares of the Company's Class A common stock for 8,500,000 Private Placement Warrants via a warrant exchange agreement. The number of shares of Class A common stock to be exchanged on a cashless basis was determined using the same methodology applied to the Public Warrants. The Company valued the Private Placement Warrants on the settlement date of exercise, using the fair market value of the Company's Class A common stock as of close on a trading day prior to the settlement date multiplied by the number of shares of Class A common stock to be issued per Warrant, which was determined in accordance with the terms of the warrant exchange agreement. No
During the fiscal year ended December 31, 2024, the Company recognized a $5.3 million loss resulting from the change in fair value of warrant liabilities through the date of exercise, exchange, or redemption within the Consolidated Statements of Operations.
Convertible Senior Notes
In May 2025, the Company issued in a private offering $400.0 million aggregate principal amount of 0.25 % Convertible Senior Notes due 2030 (the "2030 Notes"), including the initial purchasers' exercise in full of their option to purchase additional Notes. In September 2025, the Company issued in a private offering $375.0 million aggregate principal amount of 0.00 % Convertible Senior Notes due 2031 (the "2031 Notes"), including the initial purchasers' exercise in full of their option to purchase additional Notes. The 2030 Notes and 2031 Notes are accounted for in accordance with ASC 470-20, debt with Conversion and Other Options and are classified as long-term liabilities, net of issuance costs, on the Consolidated Balance Sheet as of December 31, 2025. See Note 9, Convertible Debt, for additional details.
Revenue Recognition
The Company recognizes revenue from arrangements that include performance obligations to design, engineer, manufacture, deliver, and install products. The Company identifies a performance obligation for each promise in a contract to transfer a distinct good or service to the customer. As part of its assessment, the Company considers all goods and/or services promised in the contract, regardless of whether they are explicitly stated or implied by customary business practices. The Company’s contracts may contain either a single performance obligation, including the promise to transfer individual goods or services that are not separately distinct within the context of the respective contracts, or multiple performance obligations. For contracts that contain multiple performance obligations, the Company allocates the consideration to which it expects to be entitled to each performance obligation based on relative standalone selling prices and recognizes the related revenue when or as control of each individual performance obligation is transferred to customers. The Company does not assess whether promised goods or services are performance obligations if they are immaterial in the context of the contract with the customer. The Company combines multiple contracts entered into at or around the same time with a customer if the contracts are negotiated as a package with a single commercial objective, the consideration paid under the contracts depends on the price or performance of the other contract, or if the goods or services promised in the contracts are a single performance obligation.
In most cases, installation services represent a separate performance obligation. The customer simultaneously receives and consumes the benefits as the installation services are performed. The Company determines if the installation is a separate performance obligation by evaluating whether the service is distinct within the context of the contract and capable of being distinct. In evaluating whether the installation service is capable of being distinct, we consider whether other entities could complete the installation (based on the technical complexity of the service) and whether third parties offer a similar installation service. When the product and installation service are determined to be a combined performance obligation, revenue is recognized over time as the installation is performed and included in product revenue in the consolidated statement of operations.
73
The Company’s costs to obtain contracts are typically comprised of sales commissions. A majority of these costs relate to revenue that is recognized over a period that is less than one year. For costs related to revenue recognized over a period less than one year, the Company has elected the practical expedient under ASC 606 to expense these costs as incurred. The amount of deferred cost assets and related amortization was immaterial to our financial statements.
Assurance-type warranties guarantee that a product complies with agreed-upon specifications and accordingly are not separate performance obligations. A provision for the cost of fulfilling these warranties is recognized in the period during which the associated revenue is recognized.
Variable consideration such as sales rebates, sales discounts and sales returns are estimated and treated as a reduction of revenue in the same period the related revenue is recognized. These are estimated based on contractual terms, historical practices, and current trends, and are adjusted as new information becomes available. In some of our long contracts, variable consideration includes future increases based on published price indexes in the country of the underlying contract. We constrain our estimate of this variable consideration until the price index has been published by the applicable authority. Revenues exclude any taxes that the Company collects from customers and remits to tax authorities. Amounts billed to customer for shipping and handling are included in revenue, while the related shipping and handling costs are reflected in cost of products in the period in which revenue is recognized. The Company has elected a practical expedient under ASC 606 that allows for shipping and handling activities that occur after the customer has obtained control of a good to be accounted for as a fulfillment cost. The Company does not adjust the promised amount of consideration for the effects of a significant financing component, if, at contract inception, the Company expects the period between the time when the Company transfers a promised good or service to the customer and the time when the customer pays for that good or service will be one year or less.
Certain of the Company’s products are sold through distributors and third-party sales representatives under standard agreements whereby distributors purchase products from the Company and resell them to customers. These agreements give distributors the right to sell the Company’s products within certain territories and establish minimum order requirements. These arrangements do not provide stock rotation or price protection rights and do not contain extended payment terms. Rights of return are limited to repair or replacement of delivered products that are defective or fail to meet the Company’s published specifications. Provisions for these warranty costs are recognized in the same period that the related revenue is recorded similar to other assurance-type warranties.
Performance Obligations Satisfied Over Time:
The Company exercises judgment in determining the timing of revenue by analyzing the point in time or the period over which the customer has the ability to direct the use of and obtain substantially all of the remaining benefits of the performance obligation. Typically, over-time revenue recognition is based on the utilization of the input measure of costs incurred to date relative to total estimated costs to measure progress. Throughout the life of a contract, this measure of progress captures the timing of our underlying technical performance activities (engineering design, customized material assembly, quality testing, and solution integration) which can fluctuate in the timing of delivering the customer's specifically designed solution versus the original project plans. Changes in total estimated costs are recognized using the cumulative catch-up method of accounting which recognize the cumulative effect of the changes on current and prior periods in the current period. Accordingly, the effect of the changes on future periods of contract performance is recognized as if the revised estimate had been the original estimate. Provisions for estimated losses on uncompleted contracts are made in the period in which such losses are first determined. A significant change in an estimate on one or more contracts could have a material effect on the Company’s consolidated financial position, results from operations, or cash flows. However, there were no significant changes in estimated contract costs for the years ended December 31, 2025, 2024, or 2023.
Service revenues (service-type warranty, post contract support, installation, and subscription-based services) are recognized over time as the customers receive and consume benefits of such services simultaneously.
Revenue derived from passive dosimetry and analytical services is of a subscription nature and is provided to customers on an agreed-upon recurring monthly, quarterly or annual basis. Services are provided to the customer via passive dosimeter badges that the Company supplies to customer personnel. Depending on the type of badge utilized, either customers return the used badges to the Company for analysis, or they obtain the analysis directly via a self-service web portal. The Company believes that badge production, badge wearing, badge analysis and report preparation are not individually distinct and therefore a single performance obligation recognized over time. Revenue is recognized ratably over the service period as the service is continuous, and no other discernible pattern of recognition is evident.
74
Performance Obligations Satisfied at a Point in Time:
If a performance obligation does not qualify for over-time revenue recognition, revenue is then recognized at the point-in-time in which control of the distinct good or service is transferred to the customer, typically based upon the terms of delivery. Where arrangements include customer acceptance provisions based on seller or customer-specified objective criteria, we recognize revenue when we have concluded that the customer has control of the equipment and that acceptance has occurred.
Contract Balances, Deferred Revenue and Customer Deposits
Revenue earned in excess of billings on contracts in progress (contract assets) are classified in the consolidated balance sheet in costs in excess of billings on uncompleted contracts. Amounts billed in excess of revenue earned (contract liabilities) are included in deferred contract revenue. Our billing terms for these over-time contracts are generally based on achieving specified milestones. The differences between the timing of our revenue recognized (based on costs incurred) and customer billings (based on contractual terms) results in changes to our contract asset or contract liability positions.
Milestone billing is aligned to the timing of the associated performance of the Company at the contract onset and generally occurs multiple times in a given twelve month period. Unexpected project delays could impact the contract asset or liability position during the course of a contract. Contract asset balances are reviewed by management for future credit losses by considering factors such as historical experience, the customers' financial condition and current economic conditions. In circumstances where the Company is aware of a specific customer's inability to meet its financial and contractual obligations, a specific reserve is recorded against the contract asset. As of December 31, 2025, one project accounted for more than 10% of the contract asset balance (16 %). For more information, see Note 3, Contracts in Progress.
Deferred contract revenue also includes prepayments from customers, including milestone or installment payments, on projects for which services or products have commenced. For dosimetry and analytical services, many customers pay for these measuring and monitoring services in advance and these amounts are recorded as deferred contract revenue in the consolidated balance sheets, net of a reserve for estimated cancellations. Deferred revenue expected to be realized in excess of 12 months was $2.2 million and $3.0 million as of December 31, 2025 and 2024, respectively, and is included in Other Liabilities in the Consolidated Balance Sheet.
Customer deposits represent cash received for contracts in which product manufacturing or services have not commenced and the amounts received are fully refundable if the underlying good is not delivered. Customer deposits are recorded in Accrued expenses and other current liabilities in the Consolidated Balance Sheet.
Payment terms for shipments to end-users are generally net 30 days. Payment terms for distributor shipments typically range from 30 to 90 days.
Remaining Performance Obligations
Remaining performance obligations represent committed but undelivered contracts and purchase orders at period end. Maintenance-related activity and agreements that do not represent firm purchase orders are not included in remaining performance obligations. Customer agreements that contain cancellation for convenience terms are not reflected until firm purchase orders are received. Contract modifications could affect both the timing to complete as well as the amount to be received as we fulfill the related remaining performance obligations. Expected timing of the satisfaction of performance obligations in our longer term projects can fluctuate due to changes such as procurement timing of specialized materials, engineering design changes, and changes in required technical work as determined in quality control testing.
Disaggregation of Revenues
A disaggregation of the Company’s revenues by segment, geographic region, timing of revenue recognition, product category and market category is provided in Note 17, Segment Information.
75
Founder Shares
Founder shares were shares of Class A common stock subject to certain vesting events and forfeiture if a required vesting event did not occur within five years their issuance. The founder shares were subject to vesting in three equal tranches, based on the volume-weighted average price of the Class A common stock being greater than or equal to $12 , $14 and $16 per share for any 20 trading days in any 30 consecutive trading day period. Holders of the founder shares were entitled to vote such founder shares and receive dividends and other distributions with respect to such founder shares prior to vesting, but such dividends and other distributions with respect to unvested founder shares would be set aside by the Company and only be paid to the holders of the founder shares upon the vesting of such founder shares.
During the fourth quarter of the year ended December 31, 2024, all of the founder shares met the required vesting conditions, and the Class A common shares were considered outstanding for purposes of our loss per share calculation. Previous to the vesting, since the holders of the founder shares were not entitled to participate in earnings unless the vesting conditions were met, the founders shares were previously excluded from the calculation of our loss per share.
Selling, General, and Administrative Expenses
The Company’s selling, general and administrative expenses consist of direct and indirect costs related to sales and corporate personnel, facilities, professional services, amortization of intangible assets, stock-based compensation, and other operating activities.
Advertising Costs
Research and Development
Research and development expenses include costs of developing new products and processes, as well as non-project specific design and engineering costs. Research and development costs are expensed as incurred. Development costs related to software incorporated in the Company’s products are not material.
Concentrations of Risk
Financial instruments that are potentially subject to concentration of credit risk consist primarily of cash and cash equivalents and accounts receivable. The Company maintains cash in bank deposit accounts that, at times, may exceed the insured limits of the local country. The Company has not experienced any losses in such accounts.
As of December 31, 2025, and December 31, 2024, no customer accounted for more than 10% of the accounts receivable balance. No single customer accounted for more than 10% of total revenues for the fiscal years ended December 31, 2025, and December 31, 2024.
Derivatives and Hedging
The Company uses derivatives to manage underlying commercial risks, including risks related to foreign exchange and interest rate. Accounting for derivatives as hedges requires that, at inception and over the term of the arrangement, the hedged item and related derivative meet the requirements for hedge accounting. In evaluating whether a particular relationship qualifies for hedge accounting, the Company tests effectiveness at inception and each reporting period thereafter by determining whether changes in the fair value of the derivative offset, within a specified range, changes in the fair value of the hedged item. If fair value changes fail this test, the Company discontinues applying hedge accounting to that relationship prospectively. Fair values of both the derivative instrument and the hedged item are calculated using internal valuation models incorporating market-based assumptions, subject to third-party confirmation, as applicable.
76
The changes in the fair values of derivatives that have been designated and qualify as cash flow hedges or hedges of net investments in foreign operations are recorded in accumulated other comprehensive loss ("AOCL") and are reclassified into the line item in our consolidated statement of income in which the hedged items are recorded in the same period the hedged items affect earnings. The changes in the fair values of derivatives that were not designated and/or did not qualify as hedging instruments are immediately recognized in earnings.
Stock-Based Compensation Awards
The Company adopted and obtained stockholder approval at its special meeting of the stockholders on October 19, 2021 of the 2021 Omnibus Incentive Plan (the “2021 Plan”). The purpose of the 2021 Plan is to motivate and reward employees and other individuals to perform at their highest level and contribute significantly to the success of the Company. The 2021 Plan is an omnibus plan that may provide these incentives through grant of stock options, stock appreciation rights, restricted stock, restricted stock units, performance awards, other cash-based awards and other stock-based awards to employees, directors, or consultants of the Company. See Note 15, Stock-based Compensation, for further information on this plan.
Stock-based compensation is awarded to employees and directors of the Company and accounted for in accordance with ASC 718, "Compensation—Stock Compensation." Stock-based compensation expense is recognized for equity awards over the vesting period based on their grant-date fair value. The Company uses various forms of long-term incentives including, but not limited to Restricted Stock Units (“RSUs”) and Performance-based RSUs (“PSUs”), provided that the issuance of such stock options was contingent upon the Company filing a registration statement on Form S-8 with the SEC, which occurred on December 27, 2021. The grant date fair value of the PSUs is determined using a Monte Carlo simulation model. The grant date fair value of the RSUs is determined using the closing price of the Company’s Class A common stock price on the day before the grant date. Stock-based compensation expense is included within the same financial statement caption where the recipient’s other compensation is reported. The Company accounts for forfeitures as they occur.
On June 17, 2021 membership interests were issued to certain Mirion employees and the current Chairman of the Board of Mirion (collectively, the "Profits Interests"). The Profits Interests were subject to service and performance vesting conditions and did not fully vest until all of the applicable conditions are satisfied. In addition, the Profits Interests were subject to certain forfeiture conditions. Accordingly, these awards have been treated as stock based compensation under ASC 718. The grant date fair value of the Profits Interests was based upon a valuation model using Monte Carlo simulations. During the fourth quarter of the year ended December 31, 2024, all of the Profit Interests met the required vesting conditions and were settled in full for shares of Class A common stock.
For more information see Note 15, Stock-based Compensation.
Treasury Stock
We account for treasury stock under the cost method pursuant to the provisions of ASC 505-30, Treasury Stock. Under the cost method, the gross cost of the shares reacquired is charged to a contra equity account, treasury stock. The equity accounts that were originally credited for the original share issuance, Common Stock and additional paid-in capital, remain intact.
If the treasury shares are ever reissued in the future at a price higher than its cost, the difference is recorded as a component of additional paid-in-capital in our consolidated balance sheets. When treasury stock is re-issued at a price lower than its cost, the difference is recorded as a component of additional paid-in-capital to the extent that there are previously recorded gains to offset the losses. If there are no treasury stock gains in additional paid-in-capital, the losses upon re-issuance of treasury stock are recorded as a reduction of retained earnings in our consolidated balance sheets.Treasury stock is reissued on a FIFO cost flow basis to compute excesses and deficiencies upon subsequent share reissuance.
Accounting for Income Taxes
The Company accounts for income taxes and the related accounts under the asset and liability method. Deferred tax assets and liabilities are recognized for the expected tax consequences of temporary differences between the tax bases of assets
77
and liabilities and their reported amounts. Valuation allowances are recorded to reduce deferred tax assets to the amount that will more likely than not be realized. The Company classifies all deferred tax assets and liabilities, and any related valuation allowance, as non-current in the Consolidated Balance Sheets.
The Company accounts for uncertainty in income taxes using a two-step approach to recognizing and measuring uncertain tax positions. The first step is to evaluate the tax position for recognition by determining if the weight of available evidence indicates that it is more likely than not that the position will be sustained on audit, including resolution of related appeals or litigation processes, if any. The second step is to measure the tax benefit as the largest amount that is more than 50% likely of being realized upon settlement. The Company classifies the liability for unrecognized tax benefits as current in the balance sheet, to the extent that the Company anticipates payment or receipt of cash within one year. Interest and penalties related to uncertain tax positions are recognized in the provision for income taxes.
Defined Benefit Pension Plans and Other Employee Benefits
The Company has defined benefit pension plans that cover certain of its employees in France, Japan, and Germany. The Company also has a post-retirement plan that provides for the reimbursement of a portion of medical and life insurance premiums for certain retirees and eligible dependents in the United States. Plan liabilities are revalued annually based on assumptions relating to the discount rates used to measure future obligations and expenses, salary-scale inflation rates, mortality and other assumptions. The selection of assumptions is based on historical trends and known economic and market conditions at the time of valuation; however, actual results may differ from the Company’s estimates.
Foreign Currency
Local currency is the functional currency for substantially all of the Company’s foreign operations. The functional currency was determined by the primary economic environment in which the entity operates and our review of six economic factors required in ASC 830 Foreign Currency Matters. There were no changes in our designation of functional currencies during the fiscal years 2023, 2024 and 2025.
We record gains and losses from changes in exchange rates on transactions denominated in currencies other than each reporting location’s functional currency in the consolidated statements of operations for each period.
Earnings (Loss) Per Share
Net earnings (loss) per share of common stock is computed using the two-class method required for multiple classes of common stock and participating securities based upon their respective rights to receive dividends as if all income for the period has been distributed. Basic earnings (loss) per share is computed by dividing income (loss) available to common stockholders by the weighted average number of common shares outstanding, adjusted for the outstanding non-vested shares. Diluted earnings (loss) per share is computed by giving effect to all potentially dilutive securities outstanding for the period using the treasury stock method or the if-converted method based on the nature of such securities. For periods in which the Company reports net losses, diluted net loss per common share attributable to common stockholders is the same as basic net loss per common share attributable to common stockholders, because potentially dilutive common shares are not assumed to have been issued if their effect is anti-dilutive.
Common Stock
The following classes of stock are considered in the earnings (loss) per share calculation.
Class A Common Stock
Holders of shares of our Class A common stock are entitled to one vote for each share held of record on all matters on which stockholders are entitled to vote generally, including the election or removal of directors. The holders of our Class A common stock do not have cumulative voting rights in the election of directors. Holders of shares of our Class A common stock are entitled to receive dividends when and if declared by our Board out of funds legally available therefor, subject to any statutory or contractual restrictions on the payment of dividends and to any restrictions on the payment of dividends imposed by the terms of any outstanding preferred stock. Upon our liquidation, dissolution or winding up and after
78
payment in full of all amounts required to be paid to creditors and to the holders of preferred stock having liquidation preferences, if any, the holders of shares of our Class A common stock will be entitled to receive pro rata our remaining assets available for distribution. Class A common stock issued and outstanding is included in the Company’s basic loss per share calculation.
In December 2024, the company instituted a share repurchase program for up to $100 million of the currently outstanding shares of the company’s Class A common stock, as approved by the Board of Directors of the company. Under the share repurchase program, the company intends to repurchase shares through open market purchases, privately negotiated transactions, block purchases or otherwise in accordance with applicable federal securities laws, including Rule 10b-18 of the Securities Exchange Act of 1934 (the “Exchange Act”). During the fiscal year ended December 31, 2025, the company repurchased $18.6 million in shares under this program. No shares were purchased as of December 31, 2024. As of December 31, 2025, there is $81.4 million in shares that may yet be purchased.
Class B Common Stock
Holders of shares of our Class B common stock also hold shares of IntermediateCo Class B common stock on a one-to-one basis (the "paired interests"). Holders of shares of our Class B common stock are entitled to one vote for each share held of record on all matters on which stockholders are entitled to vote generally, including the election or removal of directors. If at any time the ratio at which shares of IntermediateCo Class B common stock are redeemable or exchangeable for shares of our Class A common stock changes from a one-for-one basis, the number of votes to which our Class B common stockholders are entitled will be adjusted accordingly. The holders of our Class B common stock do not have cumulative voting rights in the election of directors. Except for transfers to us pursuant to the IntermediateCo Charter or to certain permitted transferees set forth in our Charter, the shares of our Class B common stock and corresponding shares of IntermediateCo Class B common stock may not be sold, transferred or otherwise disposed of.
Holders of shares of our Class B common stock are not entitled to economic interests in us or to receive dividends or to receive a distribution upon our liquidation or winding up. However, if IntermediateCo makes distributions to us other than solely with respect to our Class A common stock, the holders of shares of IntermediateCo Class B common stock will be entitled to receive distributions pro rata in accordance with the percentages of their respective shares of IntermediateCo Class B common stock.
Our shares of Class B common stock are excluded from the calculation of basic and diluted earnings per share because such shares have voting rights but no economic interest in the Company.
Recent Accounting Pronouncements
Accounting Guidance Issued and Adopted
In December 2023, the FASB issued ASU 2023-09 "Income Taxes (Topic 740): Improvements to Income Tax Disclosures." ASU 2023-09 enhances the existing income tax disclosures primarily related to the rate reconciliation and income taxes paid information. The amendments were effective for fiscal years beginning after December 15, 2024, and interim periods within fiscal years beginning after December 15, 2025. The Company implemented the required disclosures, including prospective application beginning in the fiscal year ending December 31, 2025, in the financial statements. See Note 12, Income Taxes.
Accounting Guidance Issued But Not Yet Adopted
In October 2023, the FASB issued ASU 2023-06 “Disclosure Improvements.” ASU 2023-06 clarifies or improves
disclosure and presentation requirements of a variety of topics. For entities subject to the SEC’s existing disclosure requirements, the effective date for each amendment will be the date on which the SEC’s removal of that related disclosure from Regulation S-X or Regulation S-K becomes effective, with early adoption prohibited. For all entities, if by June 30, 2027, the SEC has not removed the applicable requirement from Regulation S-X or Regulation S-K, the pending content of the related amendment will be removed from the codification and will not become effective for any entity. The Company is currently evaluating the impact of this ASU.
In November 2024, the FASB issued ASU 2024-03 "Income Statement—Reporting Comprehensive
Income—Expense Disaggregation Disclosures." The ASU will improve the decision usefulness for investors by requiring public business entities to disclose more detailed information about their expenses such as (a) inventory and manufacturing expense, (b) employee compensation, (c) depreciation, (d) intangible asset amortization, etc. The amendments will be effective for fiscal years beginning after December 15, 2026, and interim periods within fiscal years beginning after December 15, 2027, with early adoption permitted. The amendments will be applied prospectively with an option for a
79
retrospective application. The Company is evaluating the impact of this new standard and believes that the adoption will result in additional disclosures, but does not expect it to have any other impact on its consolidated financial statements.
In September 2025, the FASB issued ASU 2025-06 "Intangibles—Goodwill and Other—Internal-Use Software." ASU 2025-06 amends certain aspects of the accounting for and disclosure of software costs under ASC 350-40. The ASU makes targeted improvements to capitalization of costs for software developed or obtained for internal use. The amendment is expected to simplify the analysis for internal-use software cost capitalization, as entities no longer will be required to align capitalization to project stages that are not applicable to an agile development environment. The amendments will be effective for fiscal years beginning after December 15, 2027, and interim periods within those annual reporting periods, with early adoption permitted at the beginning of a reporting period. The Company is currently evaluating the impact of this ASU and plans to early adopt with prospective application beginning in fiscal year 2027.
2. Business Combinations, Acquisitions, and Business Disposals
All acquisitions are accounted for under the acquisition method of accounting, and the related assets acquired and liabilities assumed are recorded at fair value. The Company makes an initial allocation of the purchase price at the date of acquisition based upon its understanding of the fair value of the acquired assets and assumed liabilities. The Company obtains the information used for the purchase price allocation during due diligence and through other sources. In the months after closing, as the Company obtains additional information about the acquired assets and liabilities, including through tangible and intangible asset appraisals, and learns more about the newly acquired business, it is able to refine the estimates of fair value and more accurately allocate the purchase price. The fair values of acquired intangibles are determined based on estimates and assumptions that are deemed reasonable by the Company. Significant assumptions include the discount rates and certain assumptions that form the basis of the forecasted results of the acquired business including revenue, earnings before interest, taxes, depreciation and amortization (“EBITDA”), and growth rates. These assumptions are forward looking and could be affected by future economic and market conditions. Only facts and circumstances that existed as of the acquisition date are considered for subsequent adjustment. The Company will make appropriate adjustments to the purchase price allocation prior to completion of the measurement period, as required.
Purchases of acquired businesses resulted in the recognition of goodwill in the Company’s Consolidated Financial Statements, which is calculated as the excess of the consideration transferred over the net assets recognized and represents the future economic benefits arising from the other assets acquired that could not be individually identified and separately recognized. The goodwill is not amortized but some portion may be deductible for income tax purposes. This goodwill recorded includes the following:
• The expected synergies and other benefits that we believe will result from combining the operations of the acquired business with the operations of Mirion;
• Any intangible assets that did not qualify for separate recognition, as well as future, yet unidentified projects and products;
• The value of the existing business as an assembled collection of net assets versus if the Company had acquired all of the net assets separately.
Purchase of Certrec
The Company continually evaluates potential acquisitions that strategically fit with the Company’s existing portfolio. On July 31, 2025, Mirion acquired 100 % of the equity interest of Certrec for approximately $82.9 million of gross purchase consideration ($80.6 million, net of cash). Certrec is a leading supplier of regulatory compliance and digital integration solutions for the energy industry. Mirion management believes the Certrec business will be pivotal in expanding our offerings in the nuclear power market and further strengthen the development of our digital ecosystem.
Transaction costs related to Certrec were not material for the year ended December 31, 2025.
Purchase of Paragon Energy Solutions
On December 1, 2025, Mirion acquired 100 % of the outstanding membership interest of WCI-Gigawatt Intermediate Holdco, LLC, the indirect parent of Paragon Energy Solutions, LLC (“Paragon”) for $588.4 million of gross purchase consideration ($581.3 million, net of cash and net working capital adjustment), subject to final closing statement balances. As part of the Nuclear & Safety segment, Paragon is a leading provider of highly engineered solutions for large-scale nuclear power plants and small modular reactors (SMRs) in the United States. Mirion management believes that Paragon will provide Mirion's nuclear power customers with a more comprehensive suite of product offerings and services to meet
80
their growing needs. Additionally, the addition of Paragon significantly enhances our presence in the U.S. nuclear power market and the developing SMR commercial entrants.
Transaction costs related to Paragon were $14.1 million for the year ended December 31, 2025 and are included within selling, general, and administrative expenses in the Consolidated Statements of Operations.
Fair value of Assets Acquired in 2025
The following table summarizes the total business enterprise value, comprised of the fair value of net assets acquired for the current year acquisitions (in millions):
| Certrec | Paragon | ||||||||||
| Date of acquisition | July 31, 2025 | December 1, 2025 | |||||||||
| Segment | Nuclear & Safety | Nuclear & Safety | |||||||||
Goodwill (1) | $ | $ | |||||||||
| Amortizable intangible assets: | |||||||||||
Developed technology (2) | |||||||||||
Customer relationships (3) | |||||||||||
Trade names (4) | |||||||||||
Leasehold improvements (5) | |||||||||||
Backlog (6) | |||||||||||
| Total amortizable intangible assets | $ | $ | |||||||||
| Tangible assets and liabilities: | |||||||||||
| Cash | $ | $ | |||||||||
| Restricted cash—current | |||||||||||
| Accounts receivable, net | |||||||||||
| Costs in excess of billings | |||||||||||
| Inventories | |||||||||||
| Prepaid expenses and other currents assets | |||||||||||
| Property, plant, and equipment, net | |||||||||||
| Other assets | |||||||||||
| Accounts payable | ( | ( | |||||||||
| Deferred contract revenue | ( | ( | |||||||||
| Accrued expenses and other current liabilities | ( | ( | |||||||||
| Deferred income taxes, non-current | ( | ||||||||||
| Other liabilities, non-current | ( | ( | |||||||||
| Net tangible assets acquired | $ | ( | $ | ( | |||||||
| Purchase consideration | $ | $ | |||||||||
| Less: cash and restricted cash acquired | |||||||||||
| GAAP purchase consideration, net of cash acquired | $ | $ | |||||||||
| Acquiree revenue post acquisition through the period ended December 31, 2025 | $ | $ | |||||||||
| Acquiree loss from operations post acquisition through the period ended December 31, 2025 | $ | ( | $ | ( | |||||||
81
(1)The goodwill of $55.7 million and $343.7 million, respectively, represents the excess of the gross consideration transferred over the fair value of the underlying net tangible and identifiable intangible assets acquired and liabilities assumed and is attributable to the acquired assembled workforce and expected revenue and cost synergies. A portion of the goodwill recognized is expected to be deductible for income tax purposes. The purchase price allocation has not been finalized. We expect to finalize the valuation report and complete the purchase price allocation no later than one-year from the acquisition date.
(2)The useful life for developed technology ranges from 5 15
(3)The useful life for customer relationships is 10
(4)The useful life for trade names is 10
(5)The useful life for leasehold improvements is 2.7
(6)The useful life for backlog is 3
The estimated fair values of all assets acquired and liabilities assumed in the acquisitions are provisional and may be revised as a result of additional information obtained during the measurement period of up to one year from the respective acquisition date, including but not limited to, inventory, costs in excess of billings, intangible assets, deferred revenue balances and the valuation of tax accounts.
Unaudited Pro Forma Financial Information
The following unaudited pro forma financial information presents the Company's results of operations for the years ended December 31, 2025 and December 31, 2024 to illustrate the estimated effects of the acquisitions of Certrec and Paragon as if they had occurred on January 1, 2024. The pro forma financial information is presented for comparative purposes only and is not necessarily indicative of the Company's operating results that may have actually occurred had the acquisitions been completed on January 1, 2024. The unaudited pro forma financial information does not reflect the expected realization of any anticipated cost savings, operating efficiencies, or other synergies that may have been associated with the acquisitions.
| (amounts in millions) | Fiscal Year Ended December 31, 2025 | Fiscal Year Ended December 31, 2024 | |||||||||
| Total revenues | $ | $ | |||||||||
| Net income (loss) | $ | $ | ( | ||||||||
| Net income (loss) attributable to Mirion Technologies, Inc. stockholders | $ | $ | ( | ||||||||
The unaudited pro forma financial information reflects pro forma adjustments to present the combined pro forma results of operations as if the acquisitions had occurred on January 1, 2024 to give effect to certain events the Company believes to be directly attributable to the acquisitions. These pro forma adjustments primarily include:
•A net increase in cost of revenues, depreciation, and amortization expense that would have been recognized due to acquired inventory, property, plant and equipment, operating leases and intangible assets;
•An increase in amortization of deferred financing costs that would have been recognized due to the convertible senior notes obtained to finance the transaction;
•A reduction in expenses for the year ended December 31, 2025, and a corresponding increase in the fiscal year ended December 31, 2024, for acquisition-related transaction costs directly attributable to the acquisition; and
•A change in income tax expense to reflect the income tax effect of the pro forma adjustments based upon an estimated blended statutory rate of 23%.
Biodex Rehabilitation Sale to Salona Global
In the fourth quarter of the year ended December 31, 2022, the Biodex Rehabilitation ("Rehab") business was deemed as held for sale. On April 3, 2023, the Company closed the sale of Rehab to Salona Global Medical Device Corporation ("Salona") for $1.0 million in cash at closing. During the fiscal year ended December 31, 2024, the Company received an additional $1.2 million from Salona, which has been reflected as a gain on business disposal in the Consolidated Statements of Operations.
82
3. Contracts in Progress
Costs and billings on uncompleted construction-type contracts consist of the following (in millions):
| December 31, 2025 | December 31, 2024 | ||||||||||
| Costs incurred on contracts (from inception to completion) | $ | $ | |||||||||
| Estimated earnings | |||||||||||
| Contracts in progress | |||||||||||
| Less: billings to date | ( | ( | |||||||||
| $ | $ | ||||||||||
The balances reflected in the table above include the open projects acquired in the Paragon purchase; refer to Note 2, Business Combinations, Acquisitions, and Business Disposals, for additional information regarding the Paragon purchase.
The carrying amounts related to uncompleted construction-type contracts are included in the accompanying consolidated balance sheets under the following captions (in millions):
| December 31, 2025 | December 31, 2024 | ||||||||||
| Costs and estimated earnings in excess of billings on uncompleted contracts – current | $ | $ | |||||||||
Costs and estimated earnings in excess of billings on uncompleted contracts – non-current (1) | |||||||||||
Billings in excess of costs and estimated earnings on uncompleted contracts – current (2) | ( | ( | |||||||||
Billings in excess of costs and estimated earnings on uncompleted contracts – non-current (3) | ( | ( | |||||||||
| $ | $ | ||||||||||
(1)Included in other assets within the consolidated balance sheets.
(2)Included in deferred contract revenue – current within the consolidated balance sheets.
The increase in the net carrying amount at December 31, 2025 as compared to December 31, 2024 was primarily due to the acquisition of Paragon, impact of foreign exchange rates on contract balances, and timing of milestone billing. For the year ended December 31, 2025, the Company has recognized revenue of $25.5 million and reached a settlement of €4.4 million (see Note 11, Commitments and Contingencies) related to the contract liabilities balance as of December 31, 2024.
4. Inventories
The components of inventories consist of the following (in millions):
| December 31, 2025 | December 31, 2024 | ||||||||||
| Raw materials | $ | $ | |||||||||
| Work in progress | |||||||||||
| Finished goods | |||||||||||
| $ | $ | ||||||||||
83
5. Property, Plant and Equipment, Net
Property, plant and equipment, net consist of the following (in millions):
| Depreciable Lives | December 31, 2025 | December 31, 2024 | |||||||||||||||
| Land, buildings, and leasehold improvements | $ | $ | |||||||||||||||
| Machinery and equipment | |||||||||||||||||
| Badges | |||||||||||||||||
| Furniture, fixtures, computer equipment and other | |||||||||||||||||
| Software development costs - internal use | |||||||||||||||||
Construction in progress (1) | — | ||||||||||||||||
| Less: accumulated depreciation and amortization | ( | ( | |||||||||||||||
| $ | $ | ||||||||||||||||
(1) Includes $3.9 million and $5.0 million of Construction in progress for internally developed software as of December 31, 2025, and December 31, 2024, respectively.
Total depreciation expense included in costs of revenues and operating expenses was as follows (in millions):
Fiscal Year Ended December 31, 2025 | Fiscal Year Ended December 31, 2024 | Fiscal Year Ended December 31, 2023 | |||||||||||||||
| Depreciation expense in: | |||||||||||||||||
| Cost of revenues | $ | $ | $ | ||||||||||||||
| Operating expenses | $ | $ | $ | ||||||||||||||
6. Accrued Expenses and Other Current Liabilities
Accrued expenses and other current liabilities consist of the following (in millions):
December 31, 2025 | December 31, 2024 | ||||||||||
| Compensation and related benefit costs | $ | $ | |||||||||
| Customer deposits | |||||||||||
| Accrued commissions | |||||||||||
| Accrued warranty costs | |||||||||||
| Non-income taxes payable | |||||||||||
| Pension and other post-retirement obligations | |||||||||||
| Income taxes payable | |||||||||||
| Restructuring | |||||||||||
| Deferred and contingent consideration | |||||||||||
| Other accrued expenses | |||||||||||
| Total | $ | $ | |||||||||
84
7. Goodwill and Intangible Assets
Goodwill
Goodwill is calculated as the excess of consideration transferred over the net assets recognized for acquired businesses and represents future economic benefits arising from the other assets acquired that could not be individually identified and separately recognized. Goodwill is assigned to reporting units at the date the goodwill is initially recorded and is reallocated as necessary based on the composition of reporting units over time.
The Company assesses goodwill for impairment at the reporting unit level annually on the first day of the fourth quarter and upon the occurrence of a triggering event or change in circumstance that would more likely than not reduce the fair value of a reporting unit below its carrying amount.
A quantitative test performed upon the occurrence of a triggering event compares the fair value of a reporting unit with its carrying amount. The Company determines fair values for each of the reporting units, as applicable, using the market approach, when available and appropriate, or the income approach, or a combination of both. The Company assesses the valuation methodology based upon the relevance and availability of the data at the time the Company performs the valuation. If multiple valuation methodologies are used, the results are weighted appropriately.
Valuations using the market approach are derived from metrics of publicly traded companies or historically completed transactions of comparable businesses. The selection of comparable businesses is based on the markets in which the reporting units operate giving consideration to risk profiles, size, geography, and diversity of products and services. A market approach is limited to reporting units for which there are publicly traded companies that have characteristics similar to the Company's businesses.
Under the income approach, fair value is determined based on the present value of estimated future cash flows, discounted at an appropriate risk-adjusted rate. The Company uses its internal forecasts to estimate future cash flows and include an estimate of long-term future growth rates based on our most recent views of the long-term outlook for each business. Actual results may differ from those assumed in the forecasts. The Company derives its discount rates using a capital asset pricing model and by analyzing published rates for industries relevant to its reporting units to estimate the cost of equity financing. The Company uses discount rates that are commensurate with the risks and uncertainty inherent in the respective businesses and in our internally developed forecasts.
Fiscal year ended December 31, 2025
The Company performed its annual impairment assessment as of October 1, 2025, for its five reporting units. The Company performed a qualitative (Step 0) assessment for four reporting units and concluded that it was more likely than not that the fair values of the reporting units exceeded their carrying values. Therefore, the Company was not required to perform a quantitative analysis. The Company elected to perform a quantitative (Step 1) analysis for its North America reporting unit primarily due to financial performance versus plan and the results of prior quantitative tests performed. Additionally, the Company assesses factors that may impact its business, including macroeconomic conditions. For the quantitative assessment, the fair value of the North America reporting unit was determined using both a discounted cash flow methodology and a market approach methodology with peer company multiples. Under the discounted cash flow methodology, the present value of expected future cash flows utilized a discount rate of 10.5 %. The discounted cash flow used a terminal future cash flows growth rate of 3.5 %. The Company also compared fair value to peer company multiples. The Company's quantitative impairment assessment in 2025 for the North America reporting unit indicated fair value was in excess of its carrying value.
Fiscal year ended December 31, 2024
The Company performed its annual impairment assessment as of October 1, 2024, for its five reporting units. For the assessment, the fair values of the reporting units were determined using both a discounted cash flow methodology and a market approach methodology with peer company multiples. Under the discounted cash flow methodology, the present value of expected future cash flows utilized discount rates ranging from 10 % to 13 %. The discounted cash flow used a terminal future cash flows growth rate of 3.5 % for all reporting units. The Company also compared fair value to peer company multiples.
The Company's quantitative impairment assessment in 2024 for all reporting units indicated fair values were in excess of their carrying values. The results of this assessment indicated that only the DSD reporting unit had a fair value less than 20 % in excess over carrying value, but the excess was improved as compared to the October 1, 2023 assessment.
85
Fiscal year ended December 31, 2023
The Company performed its annual impairment assessment as of October 1, 2023, for its five reporting units. For the assessment, the fair values of the reporting units were determined using both a discounted cash flow methodology and a market approach methodology with peer company multiples. Under the discounted cash flow methodology, the present value of expected future cash flows utilized discount rates ranging from 12 % to 14 %. The discounted cash flow used a terminal future cash flows growth rate of 3.5 % for all reporting units. The Company also compared fair value to peer company multiples.
The Company's quantitative impairment assessment in 2023 for all reporting units indicated fair values were in excess of their carrying values. The results of this assessment indicated that the DSD, Nuclear & Safety Europe and Asia and Nuclear & Safety North America reporting units had a fair value less than 20 % in excess over carrying value, primarily due to the impairments recorded in the prior period and an increased discount rate utilized in the current year discounted cash flows.
The following table shows changes in the carrying amount of goodwill by reportable segment as of December 31, 2025, December 31, 2024, and December 31, 2023 (in millions):
| Medical | Nuclear & Safety | Consolidated | |||||||||||||||
| Balance—December 31, 2023 | $ | $ | $ | ||||||||||||||
| Measurement period adjustment | |||||||||||||||||
| Translation adjustment | ( | ( | |||||||||||||||
| Other | ( | ( | |||||||||||||||
| Balance—December 31, 2024 | |||||||||||||||||
| Acquisition of Certrec | |||||||||||||||||
| Acquisition of Paragon | |||||||||||||||||
| Translation adjustment | |||||||||||||||||
| Balance—December 31, 2025 | $ | $ | $ | ||||||||||||||
A portion of goodwill is deductible for income tax purposes.
Gross carrying amounts and cumulative goodwill impairment losses are as follows (in millions):
December 31, 2025 | December 31, 2024 | ||||||||||||||||||||||
| Gross Carrying Amount | Cumulative Impairment | Gross Carrying Amount | Cumulative Impairment | ||||||||||||||||||||
| Goodwill | $ | $ | ( | $ | $ | ( | |||||||||||||||||
Intangible Assets
Intangible assets consist of our developed technology, customer relationships, remaining performance obligations and trade names at the time of acquisition through business combinations. The customer relationships definite lived intangible assets are amortized either using the double declining balance method or on a straight-line basis, while all other definite lived intangible assets are amortized on a straight-line basis over their estimated useful lives.
86
Many of our intangible assets are not deductible for income tax purposes. A summary of intangible assets useful lives, gross carrying value and related accumulated amortization is below (in millions):
December 31, 2025 | |||||||||||||||||||||||
| Original Average Life in Years | Gross Carrying Amount | Accumulated Amortization | Net Book Value | ||||||||||||||||||||
| Customer relationships | $ | $ | ( | $ | |||||||||||||||||||
| Distributor relationships | ( | ||||||||||||||||||||||
| Developed technology | ( | ||||||||||||||||||||||
| Trade names | ( | ||||||||||||||||||||||
Remaining performance obligations and other | ( | ||||||||||||||||||||||
| Total | $ | $ | ( | $ | |||||||||||||||||||
December 31, 2024 | |||||||||||||||||||||||
| Original Average Life in Years | Gross Carrying Amount | Accumulated Amortization | Net Book Value | ||||||||||||||||||||
| Customer relationships | $ | $ | ( | $ | |||||||||||||||||||
| Distributor relationships | ( | ||||||||||||||||||||||
| Developed technology | ( | ||||||||||||||||||||||
| Trade names | ( | ||||||||||||||||||||||
Remaining performance obligations and other | ( | ||||||||||||||||||||||
| Total | $ | $ | ( | $ | |||||||||||||||||||
Aggregate amortization expense for intangible assets included in cost of revenues and operating expenses was as follows (in millions):
Fiscal Year Ended December 31, 2025 | Fiscal Year Ended December 31, 2024 | Fiscal Year Ended December 31, 2023 | |||||||||||||||
| Amortization expense for intangible assets in: | |||||||||||||||||
| Cost of revenues | $ | $ | $ | ||||||||||||||
| Operating expenses | $ | $ | $ | ||||||||||||||
Estimated future annual amortization expense is as follows (in millions):
| Fiscal year ending December 31: | |||||
| 2026 | $ | ||||
| 2027 | |||||
| 2028 | |||||
| 2029 | |||||
| 2030 | |||||
| 2031 and thereafter | |||||
| Total | $ | ||||
87
8. Borrowings
Debt (excluding convertible debt) consists of the following (in millions):
December 31, 2025 | December 31, 2024 | ||||||||||
| 2021 Credit Agreement | $ | $ | |||||||||
| Other | |||||||||||
| Total debt | |||||||||||
| Less: debt, current | ( | ( | |||||||||
| Less: deferred financing costs | ( | ( | |||||||||
| Debt, non-current | $ | $ | |||||||||
As of December 31, 2025, and December 31, 2024, the fair market value of the Company’'s 2021 Credit Agreement was $452.3 million and $696.3 million, respectively. The fair market value for the 2021 Credit Agreement was estimated using primarily level 2 inputs, including borrowing rates available to the Company at the respective period ends. The fair market value for the Company’s remaining debt approximates the respective carrying amounts as of December 31, 2025, and December 31, 2024.
2021 Credit Agreement
The Company maintains a credit agreement (the “2021 Credit Agreement”) among Mirion IntermediateCo Inc., a Delaware corporation, as Holdings, Mirion Technologies (US Holdings), Inc., as the Parent Borrower, Mirion Technologies (US), Inc., as the Subsidiary Borrower, the lending institutions party thereto, and Citibank, N.A., as the Administrative Agent and Collateral Agent.
The 2021 Credit Agreement provides for an $830.0 million senior secured first lien term loan facility and a $175.0 million senior secured revolving facility (collectively, the “Credit Facilities”). The term loan facility is scheduled to mature on June 5, 2032, and the revolving facility is scheduled to expire and mature on March 21, 2030. The agreement requires the payment of a commitment fee of 0.50 % per annum for unused revolving commitments, subject to stepdowns to 0.375 % per annum and 0.25 % per annum upon the achievement of specified leverage ratios. Any outstanding letters of credit issued under the 2021 Credit Agreement reduce the availability under the revolving line of credit.
The 2021 Credit Agreement is secured by a first priority lien on the equity interests of the Parent Borrower owned by Holdings and substantially all of the assets (subject to customary exceptions) of the borrowers and the other guarantors thereunder. Interest with respect to the facilities is based on, at the option of the borrowers, (i) a customary base rate formula for borrowings in U.S. dollars or (ii) a floating rate formula based on LIBOR (with customary fallback provisions) for borrowings in U.S. dollars, a floating rate formula based on Euro Interbank Offered Rate (“EURIBOR”) for borrowings in Euro or a floating rate formula based on SONIA for borrowings in Pounds Sterling, each as described in the 2021 Credit Agreement with respect to the applicable type of borrowing. The 2021 Credit Agreement included fallback language that seeks to either facilitate an agreement with the Company’s lenders on a replacement rate for LIBOR in the event of its discontinuance or that automatically replaces LIBOR with benchmark rates based upon the Secured Overnight Financing Rate (“SOFR”) or other benchmark replacement rates upon certain triggering events.
On June 23, 2023, the 2021 Credit Agreement was amended, among other things, to replace the interest rate based on LIBOR and related LIBOR-based mechanics applicable to U.S. Dollar borrowings under the Credit Agreement with an interest rate based on SOFR (including, solely with respect to currently outstanding term loans, a customary spread adjustment of 0.11448 %, 0.26161 %, and 0.42826 % for borrowing with interest periods of 1, 3, and 6 months, respectively) and related SOFR-based mechanics.
The 2021 Credit Agreement contains customary representations and warranties as well as customary affirmative and negative covenants and events of default. The negative covenants include, among others and in each case subject to certain thresholds and exceptions, limitations on incurrence of liens, limitations on incurrence of indebtedness, limitations on making dividends and other distributions, limitations on engaging in asset sales, limitations on making investments, and a financial covenant that the “First Lien Net Leverage Ratio” (as defined in the 2021 Credit Agreement) as of the end of any fiscal quarter is not greater than 7.00 to 1.00 if on the last day of such fiscal quarter certain borrowings outstanding under the revolving credit facility exceed 40 % of the total revolving credit commitments at such time. The covenants also contain limitations on the activities of Mirion IntermediateCo, Inc. as the “passive” holding company. If any of the events of default occur and are not cured or waived, any unpaid amounts under the 2021 Credit Agreement may be declared
88
immediately due and payable, the revolving credit commitments may be terminated and remedies against the collateral may be exercised. Mirion IntermediateCo, Inc. was in compliance with all debt covenants on December 31, 2025 and December 31, 2024.
Term Loan - The term loan initially had a seven-year term (expiring October 2028) and bore interest at the greater of LIBOR (through June 30, 2023) / SOFR (subsequent to June 30, 2023 through May 21, 2024) or 0.50 %, plus 2.75 %. On May 22, 2024, the Company entered into Amendment No. 3 (“Amendment No. 3”) to the Credit Agreement. Amendment No. 3 reduced the applicable margin rate on the term loans from 2.75 % to 2.25 % and reduced the credit spread based upon rate term to 0%, with other terms and conditions remaining consistent (effectively the existing loan was refinanced). Amendment No. 3 was accounted for prospectively as a debt modification in accordance with ASC 470-50, Debt—Modifications and Extinguishments.
On June 5, 2025, the Company entered into Amendment No. 5 to the 2021 Credit Agreement (“Amendment No. 5”). Under Amendment No. 5, the Company utilized funds from the private offering of Convertible Senior Notes due 2030 completed on May 23, 2025 (see Note 9, Convertible Debt) to repay $244.6 million in outstanding principal and $8.3 million in accrued interest as well as to extend the maturity date of the term loan to June 5, 2032 (collectively, the “June 2025 Refinancing”). The June 2025 Refinancing was accounted for as a partial extinguishment and partial modification of the term loan debt. The Company accounted for $244.6 million of the term loan principal as an extinguishment of debt; the remaining $450.0 million of principal was accounted for as a modification to the extent the principal holdings at the syndicated lender level remained unchanged. As a result, the Company recorded a loss on partial debt extinguishment of $5.8 million within the Consolidated Statement of Operations for the period ended December 31, 2025 attributed to the derecognition of a proportionate amount of unamortized deferred financing costs.
On December 8, 2025, the Company entered into Amendment No. 6 to the 2021 Credit Agreement (“Amendment No. 6”). Amendment No. 6 reduced the applicable margin rate on the term loans from 2.25 % to 2.00 %, with other terms and conditions remaining consistent (effectively the existing loan was refinanced). Amendment No. 6 was accounted for prospectively as a debt modification in accordance with ASC 470-50, Debt—Modifications and Extinguishments.
The interest rate was 5.78 % and 6.85 % as of December 31, 2025, and December 31, 2024, respectively. The Company repaid $244.6 million and zero for the period ended December 31, 2025, and the period ended December 31, 2024, respectively.
Revolving Line of Credit - The revolving line of credit arrangement initially had a five year term (expiring October 2026) and bore interest at the greater of LIBOR (through June 30, 2023) / SOFR (subsequent to June 2023) or 0 %, plus 2.25 %. The terms of the revolving line of credit were amended on March 21, 2025, through Amendment No. 4 to the 2021 Credit Agreement (“Amendment No. 4”). Under Amendment No. 4, revolving credit commitments from lenders increased from $90.0 million to $175.0 million, and the maturity date extended to March 21, 2030, subject to a “springing” maturity date that is 91 days prior to the maturity date of the outstanding term loan under the 2021 Credit Agreement (but only to the extent the outstanding principal amount of the term loan exceeds $100.0 million on the date of determination, and a final statement maturity date that is early than 91 days after March 21, 2030).
The 2021 Credit Agreement requires the payment of a commitment fee of 0.25 % per annum for unused commitments. Any outstanding letters of credit reduce the availability of the revolving line of credit. There was no 15.7 million and $17.9 million as of December 31, 2025, and December 31, 2024, respectively. The amount available on the revolver as of December 31, 2025, and December 31, 2024 was approximately $159.3 million and $72.1 million, respectively.
Deferred Financing Costs
In connection with the issuance of the 2021 Credit Agreement term loan, we incurred debt issuance costs of $21.7 million on date of issuance. In accordance with accounting for debt issuance costs, we recognize and present deferred finance costs associated with non-revolving debt and financing obligations as a reduction from the face amount of related indebtedness in our consolidated balance sheets.
In connection with the issuance of the 2021 Credit Agreement revolving line of credit, we incurred debt issuance costs of $1.8 million. We recognize and present debt issuance costs associated with revolving debt arrangements as an asset and include the deferred finance costs within other assets on our consolidated balance sheets. We amortize all debt issuance costs over the life of the related indebtedness.
89
In connection with the May 22, 2024 closing of the refinanced Credit Facilities on the term loan, the Company determined the change would be accounted for prospectively as a debt modification in accordance with ASC 470-50, Debt—Modifications and Extinguishments. As a result, the Company capitalized an additional $1.3 million for the payment of upfront lender fees.
In connection with the March 21, 2025 refinancing of the revolving line of credit under the 2021 Credit Agreement, the Company determined the change would be accounted for prospectively as a debt modification in accordance with ASC 470-50, Debt—Modifications and Extinguishments. As a result, the Company capitalized an additional $0.8 million for the payment of upfront lender fees.
In connection with the June 5, 2025 closing of the refinanced Credit Facilities, the Company determined the change would be accounted for prospectively as a partial debt extinguishment in accordance with ASC 470-50, Debt—Modifications and Extinguishments. As a result, the Company expensed $5.0 million of the remaining deferred financing costs associated with the debt prior to the June 2025 Refinancing of the Credit Facilities and a portion of the arrangement fees for the new debt of $0.8 million as a loss on partial debt extinguishment. The remaining arrangement fees for the new debt of $2.1 million were capitalized as debt issuance fees, and the remaining transaction costs of $1.1 million were allocated consistently with ASC 470-50, with $0.8 million expensed as incurred and the remaining $0.3 million capitalized as debt issuance fees. Prior to the June 2025 Refinancing, there was approximately $9.6 million of deferred issuance fees remaining to be amortized. As a result of Amendment No. 5, the partial extinguishment and modification resulted in a net reduction in deferred issuance fees of $2.6 million with a new balance of $7.0 million in debt issuance fees capitalized to be amortized over the life of the remaining debt.
For the fiscal years ended December 31, 2025, and December 31, 2024, we incurred approximately $10.0 million (including a $5.8 million loss on partial debt extinguishment for the $244.6 million early debt repayment) and $3.1 million, respectively, of amortization expense of the deferred financing costs.
Overdraft Facilities
The Company has overdraft facilities with certain German and French financial institutions. As of December 31, 2025, and December 31, 2024, there were no
Accounts Receivable Sales Agreement
We are party to an agreement to sell short-term receivables from certain qualified customer trade accounts to an unaffiliated French financial institution without recourse. Under this agreement, the Company can sell up to €12.4 million ($14.6 million) and €12.5 million ($13.0 million) as of December 31, 2025, and December 31, 2024, respectively, of eligible accounts receivables. The accounts receivable under this agreement are sold at face value and are excluded from the consolidated balance if revenue has been recognized on the related receivable. When the related revenue has not been recognized on the receivable the Company considers the accounts receivable to be collateral for short-term borrowings. As of December 31, 2025, and December 31, 2024, there was approximately $0.0 million and $0.2 million, respectively, outstanding under these arrangements included as Other in the Borrowings table above.
Total costs associated with this arrangement were immaterial for the fiscal years ended December 31, 2025, 2024, and 2023, and are included in selling, general and administrative expense in the consolidated statements of operations.
Performance Bonds and Other Credit Facilities
The Company has entered into various line of credit arrangements with local banks in France and Germany. These arrangements provide for the issuance of documentary and standby letters of credit of up to €73.5 million ($85.4 million) and €72.6 million ($75.4 million) as of December 31, 2025, and December 31, 2024, respectively, subject to certain local restrictions. As of December 31, 2025 and December 31, 2024, €37.3 million ($43.9 million) and €56.0 million ($58.2 million), respectively, of the lines had been utilized to guarantee documentary and standby letters of credit, with interest rates ranging from 0.5 % to 2.0 %. In addition, the Company posts performance bonds with irrevocable letters of credit to support certain contractual obligations to customers for equipment delivery. These letters of credit are supported by restricted cash accounts, which totaled $2.9 million and $0.4 million as of December 31, 2025 and December 31, 2024, respectively.
90
At December 31, 2025, contractual principal payments of total borrowings are as follows (in millions):
| Fiscal year ending December 31: | |||||
| 2026 | $ | ||||
| 2027 | |||||
| 2028 | |||||
| 2029 | |||||
| 2030 | |||||
| Thereafter | |||||
| Gross Payments | |||||
| Unamortized debt issuance costs | ( | ||||
| Total borrowings, net of debt issuance costs | $ | ||||
9. Convertible Debt
Convertible debt consists of the following (in millions):
| December 31, 2025 | December 31, 2024 | ||||||||||
| 2030 notes | $ | $ | |||||||||
| 2031 notes | |||||||||||
| Total convertible debt | |||||||||||
| Less: deferred financing costs | ( | ||||||||||
| Convertible debt | $ | $ | |||||||||
Convertible Senior Notes due 2030
On May 23, 2025, the Company completed a private offering of $400.0 million in aggregate principal amount of 0.25 % Convertible Senior Notes due 2030, including the initial purchasers’ exercise in full of their option to purchase additional Notes (the “2030 Notes”). The 2030 Notes were issued pursuant to an indenture, dated May 23, 2025 (the “May Indenture”). The May Indenture includes customary covenants and sets forth certain events of default after which the 2030 Notes may be declared immediately due and payable and sets forth certain types of bankruptcy or insolvency events of default involving the Company after which the outstanding principal and accrued interest of the 2030 Notes becomes automatically due and payable.
The 2030 Notes will mature on June 1, 2030, unless earlier converted, redeemed or repurchased. The 2030 Notes will bear interest from May 23, 2025 at a rate of 0.25 % per year payable semiannually in arrears on June 1 and December 1 of each year, beginning on December 1, 2025. The 2030 Notes will be convertible at the option of the holders in certain circumstances discussed below. The 2030 Notes will be convertible into cash, shares of Mirion’s Class A common stock or a combination of cash and shares of Mirion’s Class A common stock, at the Company’s election.
The initial conversion rate is 43.2751 shares of Mirion’s Class A common stock per $1,000 principal amount of 2030 Notes, which is equivalent to an initial conversion price of approximately $23.11 per share of Mirion's Class A common stock. The initial conversion price of the 2030 Notes represents a conversion premium of 32.5 % to the last reported sale price of Mirion’s Class A common stock of $17.44 per share on May 20, 2025. The conversion rate is subject to adjustment under certain circumstances in accordance with the terms of the May Indenture.
The Company may not redeem the 2030 Notes prior to June 6, 2028. The Company may redeem for cash 100 % of the principal amount of the 2030 Notes being redeemed plus accrued and unpaid interest or any portion of the 2030 Notes, at its option, on or after June 6, 2028, but only if a certain liquidity condition has been satisfied and the last reported sale price of Mirion's Class A common stock has been at least 130 % of the conversion price then in effect for at least 20 trading days (whether or not consecutive) during any 30 consecutive trading day period. If the Company redeems less than all of the outstanding 2030 Notes, at least $100.0 aggregate principal amount of the 2030 Notes must be outstanding and not subject to redemption as of, and after giving effect to, delivery of the relevant redemption notice.
91
The 2030 Notes are convertible on or after March 1, 2030 until the close of business on the second scheduled trading day immediately preceding the maturity date, but can only be early exercised under the following circumstances:
•During any calendar quarter after September 30, 2025 (and only during such calendar quarter) if the closing price of the Company's common stock for at least 20 trading days in a period of 30 consecutive trading days ending on and including the last trading day of the preceding calendar quarter is more than 130 % of the then applicable conversion price for the 2030 Notes per share of common stock.
•During the five business days immediately after any ten consecutive trading day period in which the trading price per $1,000 principal amount of 2030 Notes, as determined following a request by a holder of 2030 Notes, for each day of that period was less than 98 % of the product of the closing price of our common stock and the then applicable conversion rate.
•If the Company calls any or all of the 2030 Notes for redemption, holders may convert all or any portion of their 2030 Notes at any time prior to the close of business on the scheduled trading day prior to the redemption date, even if the 2030 Notes are not otherwise convertible at such time.
•If specified distributions to holders of our common stock are made or specified corporate events occur.
If the Company undergoes a fundamental change at any point, as defined in the May Indenture, then subject to certain conditions and limited exceptions, holders may require the Company to repurchase for cash all or any portion of their 2030 Notes in principal amounts of $1,000 or an integral multiple thereof at a repurchase price equal to 100 % of the principal amount of the 2030 Notes to be repurchased plus accrued and unpaid interest. In addition, if specific corporate events occur prior to the maturity date or if the Company issues a notice of redemption, the Company will increase the conversion rate for holders who elect to convert their 2030 Notes in connection with such a corporate event. The conditions allowing holders of the 2030 Notes to convert were not met during the year ended December 31, 2025.
Convertible Senior Notes due 2031
On September 30, 2025, concurrently with an offering of Mirion's Class A common stock, the Company completed a private offering of $375.0 million in aggregate principal amount of 0.00 % Convertible Senior Notes due 2031, including the initial purchasers’ exercise in full of their option to purchase additional Notes (the “2031 Notes”). The Company used the net proceeds from these transactions to consummate a purchase of all of the outstanding membership interests of WCI-Gigawatt Intermediate Holdco, LLC, as the indirect parent of Paragon Energy Solutions, LLC, for $585.0 million pursuant to the equity purchase agreement signed September 24, 2025. The acquisition closed on December 2, 2025. Refer to Note 2, Business Combinations, Acquisitions, and Business Disposals, for additional information.
The 2031 Notes were issued pursuant to an indenture, dated September 30, 2025 (the “September Indenture”). The September Indenture includes customary covenants and sets forth certain events of default after which the 2031 Notes may be declared immediately due and payable and sets forth certain types of bankruptcy or insolvency events of default involving the Company after which the outstanding principal and any unpaid special interest of the 2031 Notes becomes automatically due and payable.
The 2031 Notes will mature on October 1, 2031, unless earlier converted, redeemed or repurchased. The 2031 Notes will not bear regular interest, and the principal amount of the 2031 Notes will not accrete. Special interest will accrue on the 2031 Notes in the circumstances at the rates set forth within the September Indenture. The 2031 Notes will be convertible at the option of the holders in certain circumstances discussed below. The 2031 Notes will be convertible into cash, shares of Mirion’s Class A common stock or a combination of cash and shares of Mirion’s Class A common stock, at the Company’s election.
The initial conversion rate is 34.6951 shares of Mirion’s Class A common stock per $1,000 principal amount of 2031 Notes, which is equivalent to an initial conversion price of approximately $28.82 per share of Mirion's Class A common stock. The initial conversion price of the 2031 Notes represents a conversion premium of 35.0 % to the related public offering price per share of Mirion Class A common stock of $21.35 per share. The conversion rate is subject to adjustment under certain circumstances in accordance with the terms of the September Indenture.
The Company may not redeem the 2031 Notes prior to October 5, 2028. The Company may redeem for cash 100 % of the principal amount of the 2031 Notes being redeemed plus any unpaid special interest or any portion of the 2031 Notes, at its option, on or after October 5, 2028, but only if a certain liquidity condition has been satisfied and the last reported sale price of Mirion's Class A common stock has been at least 130 % of the conversion price then in effect for at least 20 trading days (whether or not consecutive) during any 30 consecutive trading day period. If the Company redeems less than all of the outstanding 2031 Notes, at least $100.0 million aggregate principal amount of the 2031 Notes must be outstanding and not subject to redemption as of, and after giving effect to, delivery of the relevant redemption notice.
92
The 2031 Notes are convertible on or after July 1, 2031 until the close of business on the second scheduled trading day immediately preceding the maturity date, but can only be early exercised under the following circumstances:
•During any calendar quarter after December 31, 2025 (and only during such calendar quarter) if the closing price of the Company's common stock for at least 20 trading days in a period of 30 consecutive trading days ending on and including the last trading day of the preceding calendar quarter is more than 130 % of the then applicable conversion price for the 2031 Notes per share of common stock.
•During the five business days immediately after any ten consecutive trading day period in which the trading price per $1,000 principal amount of 2031 Notes, as determined following a request by a holder of 2031 Notes, for each day of that period was less than 98 % of the product of the closing price of our common stock and the then applicable conversion rate.
•If the Company calls any or all of the 2031 Notes for redemption, holders may convert all or any portion of their 2031 Notes at any time prior to the close of business on the scheduled trading day prior to the redemption date, even if the 2031 Notes are not otherwise convertible at such time.
•If specified distributions to holders of our common stock are made or specified corporate events occur.
If the Company undergoes a fundamental change at any point, as defined in the September Indenture, then subject to certain conditions and limited exceptions, holders may require the Company to repurchase for cash all or any portion of their 2031 Notes in principal amounts of $1,000 or an integral multiple thereof at a repurchase price equal to 100 % of the principal amount of the 2031 Notes to be repurchased plus any unpaid special interest. In addition, if specific corporate events occur prior to the maturity date or if the Company issues a notice of redemption, the Company will increase the conversion rate for holders who elect to convert their 2031 Notes in connection with such a corporate event. The conditions allowing holders of the 2031 Notes to convert were not met during the year ended December 31, 2025.
Interest and Maturity
As of December 31, 2025, the 2030 Notes and 2031 Notes are classified as long-term liabilities, net of issuance costs of $12.4 million and $9.9 million, respectively, on the Consolidated Balance Sheets. As of December 31, 2025, the net carrying amount of the 2030 Notes and 2031 Notes approximates fair value. As the 2030 Notes and 2031 Notes were not issued at a premium, no portion of the proceeds from the issuance of the 2030 Notes and 2031 Notes met the requirements to be accounted for separately as a component of stockholders’ equity. The 2030 Notes and 2031 Notes were issued at par, and costs associated with the issuance of the 2030 Notes and 2031 Notes are amortized to interest expense over the contractual term of the respective Notes. Interest expense (including amortization of deferred issuance costs) recognized related to the 2030 Notes and the 2031 Notes for the year ended December 31, 2025 was $2.2 million and $0.4 million, respectively. No special interest was recorded for the 2031 Notes during the year ended December 31, 2025. As of December 31, 2025, the effective interest rate of the 2030 Notes is 0.88 %.
At December 31, 2025, future maturities of the 2030 and 2031 Notes are as follows (in millions):
| Fiscal year ending December 31: | |||||
| 2026 | $ | ||||
| 2027 | |||||
| 2028 | |||||
| 2029 | |||||
| 2030 | |||||
| Thereafter | |||||
| $ | |||||
Capped Call Transactions
In May 2025, subsequent to the pricing of the 2030 Notes, the Company entered into privately negotiated capped call transactions (the “May Capped Call Transactions”). The May Capped Call Transactions initially cover, subject to customary anti-dilution adjustments substantially similar to those applicable to the 2030 Notes, the number of shares of Mirion’s Class A common stock that underlie the 2030 Notes for the purpose of limiting the potentially dilutive impacts of the 2030 Notes. The cap price of the May Capped Call Transactions is initially $34.88 per share, which represents a premium of 100 % over the last reported sale price of Mirion’s Class A common stock of $17.44 per share on May 20, 2025, and is subject to certain adjustments under the terms of the May Capped Call Transactions. The initial strike price of the May Capped Call Transactions is equal to the initial conversion price of the 2030 Notes. The default settlement method
93
is net share settlement; however, the Company may elect to settle the May Capped Call Transactions in cash. The Company used $44.6 million of the proceeds from the offering of 2030 Notes to pay the cost of the May Capped Call Transactions.
In September 2025, in connection with the pricing of the 2031 Notes, the Company entered into privately negotiated capped call transactions (the "September Capped Call Transactions"). The September Capped Call Transactions initially cover, subject to customary anti-dilution adjustments substantially similar to those applicable to the 2031 Notes, the number of shares of Mirion's Class A common stock that underlie the 2031 Notes for the purpose of limiting the potentially dilutive impacts of the 2031 Notes. The cap price of the September Capped Call Transactions is initially $42.70 per share, which represents a premium of 100 % over the related public offering price per share of Mirion Class A common stock of $21.35 , and is subject to certain adjustments under the terms of the September Capped Call Transactions. The initial strike price of the September Capped Call Transactions is equal to the initial conversion price of the 2031 Notes. The default settlement method is net share settlement; however, the Company may elect to settle the September Capped Call Transactions in cash. The Company used $38.0 million of the proceeds from the offering of the 2031 Notes to pay the cost of the September Capped Call Transactions.
The Company evaluated the May and September Capped Call Transactions and determined that they should be accounted as separate transactions from the 2030 Notes and 2031 Notes, respectively. The costs of $44.6 million to purchase the May Capped Call Transactions and $38.0 million to purchase the September Capped Call Transactions were recorded as a reduction to additional paid-in capital in the Consolidated Balance Sheets as of December 31, 2025, since they are indexed to the Company’s stock and met the criteria to be classified in stockholders' equity in accordance with ASC 815-40, Contracts in Entity's Own Equity.
Share Repurchases
Concurrently with the pricing of the 2030 Notes, the Company entered into privately negotiated transactions to use $31.0 million of the net proceeds from the offering of the 2030 Notes to repurchase shares of Mirion’s Class A common stock. The Company repurchased shares of Class A common stock sold short by investors in the offering of the 2030 Notes at a purchase price per share equal to the last reported sale price of Mirion’s Class A common stock of $17.44 per share on May 20, 2025. Such repurchases of shares of Mirion’s Class A common stock are separate from, and in addition to, repurchases under the Company’s existing stock repurchase program.
10. Leased Assets
The Company primarily leases certain logistics, office, and manufacturing facilities, as well as vehicles, copiers, and other equipment. These operating leases generally have remaining lease terms between 1 month and 30 years, and some include options to extend (generally 1 to 10 years). The exercise of lease renewal options is at the Company’s discretion. The Company evaluates renewal options at lease inception and on an ongoing basis, and includes renewal options that it is reasonably certain to exercise in its expected lease terms when classifying leases and measuring lease liabilities. Lease agreements generally do not require material variable lease payments, residual value guarantees or restrictive covenants.
The table below presents the locations of the operating lease assets and liabilities on the consolidated balance sheets as of December 31, 2025, and December 31, 2024, respectively (in millions):
| Balance Sheet Line Item | December 31, 2025 | December 31, 2024 | |||||||||||||||
| Operating lease assets | Operating lease right-of-use assets | $ | $ | ||||||||||||||
| Operating lease liabilities: | |||||||||||||||||
| Current operating lease liabilities | Current operating lease liabilities | $ | $ | ||||||||||||||
| Non-current operating lease liabilities | Operating lease liability, non-current | ||||||||||||||||
| Total operating lease liabilities: | $ | $ | |||||||||||||||
The depreciable lives are limited by the expected lease term for operating lease assets and by the shorter of either the expected lease term or the economic useful life for financing lease assets.
The Company’s leases generally do not provide an implicit rate, and therefore the Company uses its incremental borrowing rate as the discount rate when measuring the lease liabilities. The incremental borrowing rate represents an estimate of the
94
interest rate the Company would incur at lease commencement to borrow an amount equal to the lease payments on a collateralized basis over the term of the lease within a particular currency environment.
The Company’s weighted average remaining lease term and weighted average discount rate for operating leases as of December 31, 2025, and December 31, 2024, respectively, are:
December 31, 2025 | December 31, 2024 | |||||||||||||
| Operating leases | ||||||||||||||
| Weighted average remaining lease term (in years) | ||||||||||||||
| Weighted average discount rate | % | % | ||||||||||||
The table below reconciles the undiscounted future minimum lease payments (displayed by year and in the aggregate) under non-cancelable operating leases with terms of more than one year to the total lease liabilities recognized on the consolidated balance sheets as of December 31, 2025 (in millions):
| Fiscal year ending December 31: | |||||
| 2026 | $ | ||||
| 2027 | |||||
| 2028 | |||||
| 2029 | |||||
| 2030 | |||||
| Thereafter | |||||
| Total undiscounted future minimum lease payments | |||||
| Less: Imputed interest | ( | ||||
| Total operating lease liabilities | $ | ||||
For the fiscal years ended December 31, 2025, December 31, 2024, and December 31, 2023, operating lease costs (as defined under ASU 2016-02) were $9.4 million, $12.5 million, and $10.7 million, respectively. Operating lease costs are included within costs of goods sold, selling, general and administrative, and research and development expenses on the consolidated statements of income and comprehensive income. Short-term lease costs, variable lease costs and sublease income were not material for the periods presented.
Cash paid for amounts included in the measurement of operating lease liabilities for the fiscal years ended December 31, 2025, December 31, 2024 and December 31, 2023, was $9.3 million, $9.0 million, and $9.8 million, respectively, and this amount is included in operating activities in the consolidated statements of cash flows. Operating lease assets obtained in exchange for new operating lease liabilities for the fiscal years ended December 31, 2025, December 31, 2024, and December 31, 2023, were $7.5 million, $4.8 million, and $2.0 million, respectively.
11. Commitments and Contingencies
Unconditional Purchase Obligations
The Company has entered into certain long-term unconditional purchase obligations with suppliers. These agreements are non-cancellable and specify terms, including fixed or minimum quantities to be purchased, fixed or variable price provisions, and the approximate timing of payment. As of December 31, 2025, unconditional purchase obligations were as follows (in millions):
| Fiscal year ending December 31: | |||||
| 2026 | $ | ||||
| 2027 | |||||
| 2028 | |||||
| 2029 | |||||
| 2030 and thereafter | |||||
| Total | $ | ||||
95
Litigation
The Company is subject to various legal proceedings, claims, litigation, investigations and contingencies arising out of the ordinary course of business. If we believe the likelihood of an adverse legal outcome is probable and the amount is reasonably estimable, we accrue a liability in accordance with accounting guidance for contingencies. On a quarterly basis, we have established procedures to assess and determine whether a probable loss exists and an estimate of a range of potential loss can be determined, including: Disclosure Committee meetings with senior management to review and monitor material legal contingency matters and litigation developments; legal, accounting and operational meetings to review and monitor material legal contingency matters and litigation developments; meetings with our general counsel, other members of the Company’s legal department, outside counsel, other third party advisors and senior management (before the filing of our periodic report) to review and monitor material legal contingency matters and litigation developments, and discussions with the Audit Committee, as appropriate.
In April 2023, one of our Russian customers made a claim against the Company, including liquidated damages for certain delays under the terms of an active project, in the amount of $19.3 million, and sent an updated claim statement in October 2023 totaling $21 million ($18 million of which accrue daily penalties), subject to a $14 million contractual cap (all amounts converted from Euros to U.S. Dollars). In November 2024, the Company reached an agreement to modify the underlying contract and the claim was rescinded by the customer. The modification was accounted for under ASC 606 Revenue Recognition which resulted in an immaterial impact to the Consolidated Statement of Operations for the fiscal year ended December 31, 2024. The agreement will be fully executed once performance guarantees (consistent with our normal business practices) are obtained, which have been delayed due to the current Russian sanctions.
In June 2023, the same Russian customer made a demand against the Company for the return of all payments received by the Company ($10.2 million) related to a Finland nuclear power plant project cancelled in May 2022. In September 2024, the Company entered into a settlement agreement with the customer agreeing to refund €4.4 million to the customer, which was paid in June 2025.
12. Income Taxes
The domestic and foreign components of income (loss) before provision for income taxes and the provision for income taxes were as follows (in millions):
Fiscal Year Ended December 31, 2025 | Fiscal Year Ended December 31, 2024 | Fiscal Year Ended December 31, 2023 | |||||||||||||||
| United States | $ | ( | $ | ( | $ | ( | |||||||||||
| Foreign | |||||||||||||||||
| Net income (loss) before provision/(benefit) from income taxes | $ | $ | ( | $ | ( | ||||||||||||
| Income tax provision/(benefit): | |||||||||||||||||
| Current: | |||||||||||||||||
| Federal | $ | $ | $ | ||||||||||||||
| State and local | |||||||||||||||||
| Foreign | |||||||||||||||||
| Total current provision/(benefit) | $ | $ | $ | ||||||||||||||
| Deferred: | |||||||||||||||||
| Federal | $ | ( | $ | ( | $ | ( | |||||||||||
| State and local | ( | ( | |||||||||||||||
| Foreign | ( | ( | ( | ||||||||||||||
| Total deferred provision/(benefit) | $ | ( | $ | ( | $ | ( | |||||||||||
| Total provision/(benefit) from income taxes | $ | $ | $ | ( | |||||||||||||
96
The table below provides the updated requirements of ASU 2023-09 for 2025. See Note 1, Nature of Business and Summary of Significant Accounting Policies for additional details on the adoption of ASU 2023-09.
The provision (benefit) for income taxes differs from the amount computed by applying the U.S. Federal statutory income tax rate to income before provision for income taxes as follows (amounts in millions):
| Fiscal Year Ended December 31, 2025 | |||||||||||
| Amount | Percent | ||||||||||
| U.S. Federal statutory tax rate | $ | % | |||||||||
State and local taxes, net of federal impact (1) | % | ||||||||||
| Foreign tax effects | |||||||||||
| Belgium | % | ||||||||||
| Canada | |||||||||||
| Effect of statutory rate difference | ( | ( | % | ||||||||
| Local income tax effect | % | ||||||||||
| Other | % | ||||||||||
| France | |||||||||||
| Effect of statutory rate difference | % | ||||||||||
| Research and development incentives | ( | ( | % | ||||||||
| Other | % | ||||||||||
| Germany | |||||||||||
| Effect of statutory rate difference | ( | ( | % | ||||||||
| Local income tax effect | % | ||||||||||
| Other | ( | ( | % | ||||||||
| United Kingdom | |||||||||||
| Change in valuation allowance | % | ||||||||||
| Other foreign jurisdictions | — | % | |||||||||
| Effect of changes in tax laws or rates enacted in the current period | % | ||||||||||
| Effect of cross-border tax laws | |||||||||||
| Global intangible low-taxed income, net of foreign tax credits | % | ||||||||||
| Subpart F income, net of foreign tax credits | % | ||||||||||
| Foreign-derived intangible income | ( | ( | % | ||||||||
| Research and development tax credits | ( | ( | % | ||||||||
| Change in valuation allowance | ( | ( | % | ||||||||
| Nontaxable or nondeductible items | |||||||||||
| Transaction costs | % | ||||||||||
| Stock-based compensation | % | ||||||||||
| Other | % | ||||||||||
| Changes in unrecognized tax benefits | % | ||||||||||
| Total effective income tax rate | $ | % | |||||||||
(1) State taxes in California, Florida, Maryland, Pennsylvania, and Tennessee contributed to the majority (greater than 50%) of the tax effect in this category for 2025.
97
As previously disclosed for the years ended December 31, 2024, and 2023, prior to the adoption of ASU 2023-09, the provision (benefit) for income taxes differs from the amount computed by applying the U.S. Federal statutory income tax rate to loss before provision for income taxes as follows:
Fiscal Year Ended December 31, 2024 | Fiscal Year Ended December 31, 2023 | ||||||||||
| Income tax at U.S. Federal statutory rate | % | % | |||||||||
| State and local taxes, net of federal impact | % | % | |||||||||
| Foreign tax rate differential | ( | % | ( | % | |||||||
| U.S. tax on foreign earnings, net of foreign tax credits | ( | % | ( | % | |||||||
| State and local tax legislative changes | % | % | |||||||||
| Research and development tax credits | % | % | |||||||||
| U.S. foreign derived intangible income deduction | % | % | |||||||||
| Change in valuation allowance | ( | % | ( | % | |||||||
| Unrecognized tax benefits | % | ( | % | ||||||||
| Stock-based compensation expense | ( | % | ( | % | |||||||
| Warrant liability change in fair value | ( | % | ( | % | |||||||
| Impact of foreign exchange | % | ( | % | ||||||||
| Non-deductible compensation | ( | % | % | ||||||||
| Other | ( | % | % | ||||||||
| Total effective income tax rate | ( | % | % | ||||||||
As of December 31, 2025, we continue to assert indefinite reinvestment of undistributed earnings of our subsidiaries outside the U.S. It is not practical for us to determine the amount of the unrecognized deferred tax liability for federal, state, foreign or withholding taxes on other earnings and profits that are indefinitely reinvested due to complexities associated with our organizational structure; reorganizations and acquisitions which occurred during the year; changes in U.S. federal and state tax laws due to the enactment of the One Big Beautiful Bill Act (OBBBA); local law restrictions that may apply to a portion of such earnings; and various tax planning alternatives we could employ if we repatriated these earnings.
The OECD (Organization for Economic Co-operation and Development) has proposed a global minimum tax of 15% of reported profits (Pillar Two) and many countries have incorporated Pillar Two model rule concepts into their domestic laws. Pillar Two legislation is effective for the Company for the year ended December 31, 2025. Although the model rules provide a framework for applying the minimum tax, countries may enact Pillar Two slightly differently than the model rules and on different timelines. For the year ended December 31, 2025, the impact of Pillar Two on our consolidated financial statements was not material.
98
The components of the Company’s net deferred tax assets and liabilities consist of the following (in millions):
December 31, 2025 | December 31, 2024 | ||||||||||
| Deferred tax assets: | |||||||||||
| Net operating losses, tax credit carryforwards, and other | $ | $ | |||||||||
| Compensation and employee benefits | |||||||||||
| Capitalized inventory and reserves | |||||||||||
| Deferred and other revenue differences | |||||||||||
| Interest carryforwards | |||||||||||
| Other reserves and accrued expenses | |||||||||||
| Lease liabilities | |||||||||||
| Derivatives | |||||||||||
| Other assets | |||||||||||
| Capitalized research and development | |||||||||||
| Total gross deferred tax assets | |||||||||||
| Less: valuation allowance | ( | ( | |||||||||
| Total deferred tax assets | $ | $ | |||||||||
| Deferred tax liabilities: | |||||||||||
| Purchased technologies and other intangibles | $ | ( | $ | ( | |||||||
| Deferred and other revenue differences | ( | ( | |||||||||
| Property, plant and equipment | ( | ( | |||||||||
| Lease right of use assets | ( | ( | |||||||||
| Other liabilities | ( | ( | |||||||||
| Total gross deferred tax liabilities | ( | ( | |||||||||
| Net deferred tax liabilities | $ | ( | $ | ( | |||||||
The amount of cash taxes paid for income tax is as follows (in millions):
| Fiscal Year Ended December 31, 2025 | |||||
| Cash paid during the period for income taxes, net of refunds: | |||||
| U.S. Federal | $ | ||||
| U.S. State | |||||
| Foreign | |||||
| France | |||||
| Canada | |||||
| Belgium | |||||
| Germany | |||||
| Other foreign jurisdictions | |||||
| Total | $ | ||||
Management regularly evaluates the recoverability of deferred tax assets and recognizes the tax benefit only if reassessment demonstrates that they are more likely than not realizable. At such time, if it is determined that it is more likely than not that the deferred tax assets are realizable, the valuation allowance will be adjusted. In assessing the need for a valuation allowance, management considers all available evidence, both positive and negative, including reversals of
99
existing temporary differences; historical levels of income; expectations and risks associated with estimates of future taxable income; and any ongoing tax planning strategies.
At December 31, 2025, the Company evaluated the realizability of the deferred tax assets and concluded that a valuation allowance of $32.0 million, mostly relating to interest carryforwards and non-U.S. net operating losses, should continue to be recorded. At December 31, 2024, the valuation allowance was $32.9 million, mostly relating to interest carryforwards and non-U.S. net operating losses. At December 31, 2023, the valuation allowance was $30.0 million, mostly relating to interest carryforwards and non-U.S. net operating losses.
| (in millions) | Fiscal Year Ended December 31, 2025 | Fiscal Year Ended December 31, 2024 | Fiscal Year Ended December 31, 2023 | ||||||||||||||
| Balance, beginning of period | $ | $ | $ | ||||||||||||||
| Increases from business combinations | |||||||||||||||||
| Other increases | |||||||||||||||||
| Other decreases | ( | ( | ( | ||||||||||||||
| Balance, end of period | $ | $ | $ | ||||||||||||||
For the year ended December 31, 2025, the Company decreased the valuation allowance due to a change in the realizability of interest carryforwards in the U.S., a portion of which was recognized in continuing operations offset by an increase in the valuation allowance recognized in additional paid-in capital. Additionally, the Company increased the valuation allowance due to additional net operating losses in the U.K. For the year ended December 31, 2024, the Company increased the valuation allowance by $2.9 million primarily related to an increase in interest carryforwards and a decrease in tax credits in the U.S. For the year ended December 31, 2023, the Company increased the valuation allowance by $6.1 million primarily related to interest and capital loss carryforwards in the U.S.
As of December 31, 2025, the Company had U.S. federal, U.S. state, and non-U.S. net operating loss carryforwards of $36.6 million, $42.5 million, and $42.9 million, respectively. The U.S. federal net operating loss has an indefinite carryover period. A majority of the U.S. state net operating losses will continue to expire in years ending December 31, 2026 through 2044. Materially, the foreign net operating losses have an indefinite carryover period. As of December 31, 2025, the Company had U.S. federal and state tax credit carryforwards of $0.6 million available to offset future U.S. federal and state income taxes payable. U.S. federal and state tax credit carryforwards will expire in years ending December 31, 2026 through 2044.
The ability to utilize U.S. federal and state attributes may be limited under Section 382 of the Internal Revenue Code, in the event of an "ownership change." An "ownership change" is defined by Section 382 as a cumulative change in ownership of the Company of more than 50% within a three-year period. Section 382 imposes an annual limitation on the amount of post-ownership change taxable income that may be offset with pre-ownership change net operating losses or income tax liability that may be offset with pre-ownership change tax credit carryforwards of the loss corporation experiencing the ownership change. As a result of the Paragon acquisition, pre-ownership attributes including net operating losses and interest carryforwards are subject to the limitations of Section 382 of the Internal Revenue Code and similar state tax laws. As of December 31, 2025, the Company does not expect the use of U.S. federal and state attributes to be restricted. The Company continues to monitor the impact of the ownership change on attributes as future changes in the business could further limit the use of these attributes.
100
As of December 31, 2025, the Company had $8.0 million of unrecognized tax benefits related to uncertain tax positions, all of which would affect its effective tax rate if recognized. As of December 31, 2024, the Company had $7.5 million of unrecognized tax benefits related to uncertain tax positions, all of which would affect its effective tax rate if recognized. As of December 31, 2023, the Company had $8.4 million of unrecognized tax benefits related to uncertain tax positions, all of which would affect its effective tax rate if recognized. A reconciliation of the beginning and ending amount of unrecognized tax benefits is as follows (in millions):
Fiscal Year Ended December 31, 2025 | Fiscal Year Ended December 31, 2024 | Fiscal Year Ended December 31, 2023 | |||||||||||||||
| Balance, beginning of period | $ | $ | $ | ||||||||||||||
| Current year additions to positions | |||||||||||||||||
| Additions from business combinations | |||||||||||||||||
| Lapse of applicable statute of limitations | ( | ( | ( | ||||||||||||||
| Reductions to prior year positions | ( | ( | ( | ||||||||||||||
| Foreign currency translation adjustments | |||||||||||||||||
| Balance, end of period | $ | $ | $ | ||||||||||||||
The Company has recorded $6.7 million, $6.3 million, and $7.1 million of unrecognized tax benefits as non-current income taxes payable as of December 31, 2025, December 31, 2024, and December 31, 2023, respectively. The Company has also recorded $1.3 million, $1.2 million, and $1.3 million of unrecognized tax benefits as a reduction of deferred income taxes, non-current in the accompanying consolidated balance sheets at December 31, 2025, December 31, 2024, and December 31, 2023, respectively.
The Company recognizes interest and penalties related to uncertain tax positions as a component of income tax expense. Accrued interest and penalties as of December 31, 2025, December 31, 2024, and December 31, 2023, were approximately $1.9 million, $1.7 million, and $1.2 million, respectively. The ultimate amount and timing of any future cash settlements cannot be predicted with reasonable certainty.
The Company conducts business globally and, as a result, one or more of its subsidiaries files U.S. federal and state income tax returns and income tax returns in other foreign jurisdictions. In the normal course of business, the Company is subject to examination by taxing authorities throughout the world, including such major jurisdictions as the United Kingdom, France, Germany, Canada, and the United States. With the exception of a few insignificant jurisdictions, the Company is no longer subject to U.S. federal or non-U.S. income tax examinations for years prior to June 30, 2018. The Company is no longer subject to U.S. state and local income tax examinations for years prior to the 2007 tax year.
In many cases, the Company’s uncertain tax positions are related to tax years that remain subject to examination by tax authorities. The following describes open tax years by major tax jurisdictions as of December 31, 2025:
| Years Open | |||||
| Jurisdiction: | |||||
| Canada | 2020 – 2025 | ||||
| France | 2023 – 2025 | ||||
| Germany | 2020 – 2025 | ||||
| United Kingdom | 2023 – 2025 | ||||
| United States—Federal | 2017 – 2025 | ||||
| United States—State | 2007 – 2025 | ||||
101
13. Supplemental Disclosures to Consolidated Statements of Cash Flows
Supplemental cash flow information and schedules of non-cash investing and financing activities (in millions):
Fiscal Year Ended December 31, 2025 | Fiscal Year Ended December 31, 2024 | Fiscal Year Ended December 31, 2023 | |||||||||||||||
| Cash Paid For: | |||||||||||||||||
| Cash paid for interest | $ | $ | $ | ||||||||||||||
| Cash paid for income taxes | $ | $ | $ | ||||||||||||||
| Non-Cash Investing and Financing Activities: | |||||||||||||||||
| Property, plant, and equipment purchases in accounts payable | $ | $ | $ | ||||||||||||||
| Property, plant, and equipment purchases in accrued expense and other liabilities | $ | $ | $ | ||||||||||||||
| Public warrants exercises and private warrants exchange (see Note 1) | $ | $ | $ | ||||||||||||||
The following table provides a reconciliation of cash, cash equivalents and restricted cash reported within the consolidated balances sheets that sum to the total of the same such amounts shown in the consolidated statements of cash flows (in millions).
Fiscal Year Ended December 31, 2025 | Fiscal Year Ended December 31, 2024 | Fiscal Year Ended December 31, 2023 | |||||||||||||||
| Cash and cash equivalents | $ | $ | $ | ||||||||||||||
| Restricted cash—current (included within prepaid expenses and other current assets) | |||||||||||||||||
| Restricted cash—non-current (included within other assets) | |||||||||||||||||
| Total cash, cash equivalents, and restricted cash | $ | $ | $ | ||||||||||||||
Amounts included in restricted cash represent funds with various financial institutions to support performance bonds with irrevocable letters of credit for contractual obligations to certain customers.
14. Employee Benefit Plans
Defined Benefit Pension Plans
The Company maintains contributory and noncontributory defined benefit plans for certain employees in France, Japan and Germany. Plan benefits are generally based on each employee’s years of service and final salary. The unfunded benefit obligation recognized in the consolidated balance sheets related to these plans was $9.8 million and $9.1 million at December 31, 2025 and December 31, 2024, respectively. Benefits expense related to these plans was $1.4 million, $1.4 million, and $1.1 million for the fiscal years ended December 31, 2025, December 31, 2024 and December 31, 2023, respectively. The amount recognized in accumulated other comprehensive loss related to these plans was a $1.6 million and $1.4 million gain at December 31, 2025 and December 31, 2024, respectively. The estimated future benefit payments over the next ten years are $6.3 million. The estimated gains and losses, net, that will be amortized from accumulated other comprehensive income into benefits expense over the next fiscal year are not significant.
102
Other Post-Retirement Benefit Plans
The Company maintains a post-retirement benefit plan for certain eligible employees in the United States. Under the provisions of the plan, certain retired employees will secure their own health insurance coverage, and the Company will reimburse the retired employee an amount specified in the plan. The unfunded benefit obligation recognized in the consolidated balance sheets related to this plan was $0.2 million and $0.2 million at December 31, 2025 and December 31, 2024, respectively. Benefits expense related to these plans was negligible for all periods presented. The Company also offers a discretionary retirement plan to certain eligible employees whereby they may defer a portion of their compensation until retirement.
Defined Contribution Plans
15. Stock-Based Compensation
Stock-based compensation is awarded to employees and directors of the Company and accounted for in accordance with ASC 718, "Compensation—Stock Compensation." Stock-based compensation expense is recognized for equity awards over the vesting period based on their grant-date fair value. Stock-based compensation expense is included within the same financial statement caption where the recipient’s other compensation is reported. The Company accounts for forfeitures as they occur. The Company uses various forms of long-term incentives including, but not limited to restricted stock units ("RSUs") and performance-based restricted units ("PSUs"), provided that the granting of such equity awards is in accordance with the Company's 2021 Omnibus Incentive Plan (the "2021 Plan").
2021 Omnibus Incentive Plan
We adopted and obtained stockholder approval at the special meeting of the stockholders on October 19, 2021 of the 2021 Plan. We initially reserved 19,952,329 shares of Class A common stock for issuance pursuant to awards under the 2021 Plan. The total number of shares of Class A common stock available for issuance under the 2021 Plan will be increased on the first day of each fiscal year following the date on which the 2021 Plan was adopted in an amount equal to the least of (i) three percent (3 %) of the outstanding shares of Class A common stock on the last day of the immediately preceding fiscal year, (ii) 9,976,164 shares of Class A common stock and (iii) such number of shares of Class A common stock as determined by the Committee (as defined and designated under the 2021 Plan) in its discretion. Pursuant to these automatic increase provisions, the number of shares of Class A common stock reserved for issuance pursuant to awards under the 2021 Plan increased to 45,269,801 shares at January 1, 2025. Any employee, director or consultant of the Company or any of its subsidiaries or affiliates is eligible to receive an award under the 2021 Plan, to the extent that an offer of such award is permitted by applicable law, stock market or exchange rules, and regulations or accounting or tax rules and regulations. The 2021 Plan provides for the grant of stock options (including incentive stock options and non-qualified stock options), stock appreciation rights, restricted stock, RSUs, PSUs, other stock-based awards, or any combination thereof. Each award will be set forth in a separate grant notice or agreement and will indicate the type and terms and conditions of the award.
The purpose of the 2021 Plan is to motivate and reward employees and other individuals to perform at their highest level and contribute significantly to the success of the Company. As of December 31, 2025, there were 39,701,715 shares available to be granted under the 2021 Plan, assuming the PSUs previously granted vest at 100 % of their performance targets except for FY23 organic revenue growth PSUs that are estimated to vest at 200
103
The table below summarizes certain data for our stock-based compensation plans (in millions):
Fiscal Year Ended December 31, 2025 | Fiscal Year Ended December 31, 2024 | Fiscal Year Ended December 31, 2023 | |||||||||||||||
| Stock-based compensation expense - Profits Interests | $ | $ | $ | ||||||||||||||
| Stock-based compensation expense - Omnibus Plan (excluding directors) | $ | $ | $ | ||||||||||||||
| Stock-based compensation expense - Omnibus Plan (directors) | $ | $ | $ | ||||||||||||||
Tax benefit for stock-based compensation (1) | $ | $ | $ | ||||||||||||||
(1) Tax benefit (expense) was zero
Restricted Stock Units
RSUs represent a right to receive one share of the Company's Class A common stock that is both nontransferable and forfeitable unless and until certain conditions are satisfied. Certain RSUs vest ratably over various service periods ranging from to five years . The fair value of the RSUs is determined using the Company’s closing share price for the business day preceding the grant date. The expense will be recognized on a straight-line basis over the related service period for each tranche of awards.
Performance-based Restricted Stock Units
2025 Issuances
During the year ended December 31, 2025, the Company granted PSUs that vest over a three-year performance period and are subject to service and performance/market vesting conditions. The number of PSUs to be earned is determined based upon attainment of certain performance goals over the course of the performance period. The recipient will generally forfeit all of the awards if the recipient is no longer providing services to the Company before the end of the performance measurement period. PSUs are considered variable in that compensation could range from 0 % to 250 % of the award agreement's target contingent on the performance level attained. Fifty percent (50 %) of the PSU awards shall vest based a performance condition determined by the Company's adjusted EBITDA with interpolated achievement levels. The remaining fifty percent (50 %) of the PSU awards shall vest based on a performance condition determined by the Company’s cumulative Management adjusted free cash flow ("adjusted cash flow") with interpolated achievement levels. If certain minimum performance levels are not attained in the performance period, none of the PSUs will become vested. The overall payout result per the performance conditions shall be adjusted based on a market condition modifier (+/- 25%) determined by the Company's relative total shareholder return (TSR) during the performance period of January 1, 2025 to December 31, 2027, measured as a comparative percentile to the Company’s peers in the Russell 2000 Industrials index. The fair value of the PSUs is determined using a Monte Carlo simulation model on the grant date with the following assumptions:
| March 1, 2025 | ||||||||
| MIR Stock Price | $ | |||||||
Expected volatility(1) | % | |||||||
Risk-free interest rate(2) | % | |||||||
| Dividend yield | % | |||||||
| Fair value | $ | |||||||
(1) Expected volatility is based on historical volatilities from a group of comparable entities for a time period similar to that of the expected term.
(2) The risk-free rate is based on an average of U.S. Treasury yields in effect at the time of grant corresponding with the expected term.
2024 Issuances
During the year ended December 31, 2024, the Company granted PSUs that vest over a three-year performance period and are subject to service and performance/market vesting conditions. The number of PSUs to be earned is determined based
104
upon attainment of certain performance goals over the course of the performance period. The recipient will generally forfeit all of the awards if the recipient is no longer providing services to the Company before the end of the performance measurement period. PSUs are considered variable in that compensation could range from 0 % to 200 % of the award agreement's target contingent on the performance level attained. Fifty percent (50 %) of the PSU awards shall vest based a performance condition determined by the Company's adjusted EBITDA with interpolated achievement levels. The remaining fifty percent (50 %) of the PSU awards shall vest based on a performance condition determined by the Company’s cumulative Management adjusted free cash flow ("adjusted cash flow") with interpolated achievement levels. If certain minimum performance levels are not attained in the performance period, none of the PSUs will become vested. The overall payout result per the performance conditions shall be adjusted based on a market condition modifier (+/- 10%) determined by the Company's relative total shareholder return (TSR) during the performance period of January 1, 2024 to December 31, 2026, measured as a comparative percentile to the Company’s peers in the Russell 2000 Industrials index. The fair value of the PSUs is determined using a Monte Carlo simulation model on the grant date with the following assumptions:
| March 1, 2024 | ||||||||
| MIR Stock Price | $ | |||||||
Expected volatility(1) | % | |||||||
Risk-free interest rate(2) | % | |||||||
| Dividend yield | % | |||||||
| Fair value | $ | |||||||
(1) Expected volatility is based on historical volatilities from a group of comparable entities for a time period similar to that of the expected term.
(2) The risk-free rate is based on an average of U.S. Treasury yields in effect at the time of grant corresponding with the expected term.
2023 Issuances
The PSUs granted in 2023 vest over a three-year performance period and are subject to service and performance/market vesting conditions. The number of PSUs to be earned is determined based upon attainment of certain performance goals over the course of the performance period. The recipient will generally forfeit all of the awards if the recipient is no longer providing services to the Company before the end of the performance measurement period. Fifty percent (50 %) of the PSU awards shall vest based on a market condition determined by the Company’s relative total shareholder return (TSR) during the performance period measured as a comparative percentile to the Company’s peers in the Russell 2000 Industrials index with interpolated achievement levels. The remaining fifty percent (50 %) of the PSU awards shall vest based on performance condition determined by the Company’s organic revenue growth percentage during the performance period with interpolated achievement levels. If certain minimum performance levels are not attained in the performance period, none of the PSUs will become vested. As of December 31, 2025, the portion of the 2023 PSU awards that vest based on organic revenue growth are estimated to vest at 200 zero to 200 % of the award agreement's target contingent on the performance level attained. The fair value of the performance condition PSUs is determined using the Company’s closing share price for the business day preceding the grant date. The fair value of the market condition PSUs is determined using a Monte Carlo simulation model on the grant date with the following assumptions:
| March 29, 2023 | ||||||||
| MIR Stock Price | $ | |||||||
Expected volatility(1) | % | |||||||
Risk-free interest rate(2) | % | |||||||
| Dividend yield | % | |||||||
| Fair value | $ | |||||||
(1) Expected volatility is based on historical volatilities from a group of comparable entities for a time period similar to that of the expected term.
(2) The risk-free rate is based on an average of U.S. Treasury yields in effect at the time of grant corresponding with the expected term.
105
Director Restricted Stock Units
Members of the Company's Board of Directors ("Director(s)") receive annual grants of RSUs ("Director RSUs") that vest quarterly in four installments over the four quarters of the Director's service following the grant date. The expense is recognized on a straight-line basis over the related service period for each tranche of awards.
Activity of our RSUs, PSUs, and Director RSUs is as follows:
| RSUs | PSUs | Director RSUs | |||||||||||||||||||||||||||||||||
| Quantity | Weighted average grant date fair value | Quantity | Weighted average grant date fair value | Quantity | Weighted average grant date fair value | ||||||||||||||||||||||||||||||
| Total awards outstanding at December 31, 2022 | $ | $ | $ | ||||||||||||||||||||||||||||||||
| Awards granted | |||||||||||||||||||||||||||||||||||
| Awards vested | |||||||||||||||||||||||||||||||||||
| Awards forfeited | |||||||||||||||||||||||||||||||||||
| Total awards outstanding at December 31, 2023 | $ | $ | $ | ||||||||||||||||||||||||||||||||
| Awards granted | |||||||||||||||||||||||||||||||||||
| Awards vested | |||||||||||||||||||||||||||||||||||
| Awards forfeited | |||||||||||||||||||||||||||||||||||
| Total awards outstanding at December 31, 2024 | $ | $ | $ | ||||||||||||||||||||||||||||||||
| Awards granted | |||||||||||||||||||||||||||||||||||
| Awards vested | |||||||||||||||||||||||||||||||||||
| Awards forfeited | |||||||||||||||||||||||||||||||||||
| Total awards outstanding at December 31, 2025 | $ | $ | $ | ||||||||||||||||||||||||||||||||
Unrecognized compensation cost and weighted average periods remaining for non-vested awards as of December 31, 2025, are as follows (dollars in millions):
As of December 31, 2025 | Weighted average period remaining for non-vested awards as of December 31, 2025 | ||||||||||
| RSUs | $ | ||||||||||
| PSUs | |||||||||||
| Director RSUs | |||||||||||
| Total unrecognized compensation cost | $ | ||||||||||
Profits Interests
On June 17, 2021, the former sponsor of GS Acquisition Holdings Corp II, with which the Company consummated its business combination on October 21, 2021, issued 4,200,000 Profits Interests to Lawrence Kingsley, the current Chairman of the Board of Directors of the Company, 3,200,000 Profits Interests to Thomas Logan, the Chief Executive Officer of Mirion, and 700,000 Profits Interests to Brian Schopfer, the Chief Financial Officer of Mirion. The Profits Interests were intended to be treated as profits interests for U.S. income tax purposes, pursuant to which Messrs. Logan, Schopfer and Kingsley had an indirect interest in the founder shares held by the sponsor. During the fourth quarter of the year ended December 31, 2024, all of the Profit Interests met the required vesting conditions and were settled for shares of Class A common stock. The expense was recognized on a straight-line basis over the related service period for each tranche of awards, which concluded in October 2024.
106
16. Related-Party Transactions
Founder Shares
The former sponsor of GS Acquisition Holdings Corp II ("GSAH"), with which the Company consummated its business combination on October 21, 2021, owned 18,750,000 of certain shares of Class A common stock ("founder shares") which were subject to certain vesting and forfeiture conditions and transfer restrictions, including performance vesting conditions under which the price per share of Mirion's Class A common stock must meet or exceed certain established thresholds of $12 , $14 , or $16 per share for 20 out of 30 trading days before the October 21, 2026). During the fourth quarter of the year ended December 31, 2024, all of the founder shares met the required vesting conditions.
Private Placement Warrants
The former sponsor purchased an aggregate of 8,500,000 private placement warrants (the "Private Placement Warrants") at a price of $2.00 per whole warrant ($17.0 million in the aggregate) in a private placement (the “Private Placement”) that closed concurrently with the closing of GSAH's initial public offering (the "IPO"). Each Private Placement Warrant was exercisable for one whole share of Class A common stock at a price of $11.50 per share, subject to adjustment in certain circumstances, including upon the occurrence of certain reorganization events. The Private Placement Warrants were non-redeemable and exercisable on a cashless basis so long as they were held by the sponsor or its permitted transferees.
The Private Placement Warrants were accounted for as liabilities as they contained terms and features that did not qualify for equity classification under ASC 815. During the fiscal year ended December 31, 2024, the private placement warrants were exchanged for the Company's Class A common stock. See Note 1, Nature of Business and Summary of Significant Accounting Policies, for further details.
Profits Interests
17. Segment Information
During the year ended December 31, 2024, the Company renamed its Technologies segment as "Nuclear & Safety."
The Company manages its operations through two
Description of Segments
The Medical segment provides solutions focused on ensuring safety of equipment and personnel in the medical field. The primarily product category relates to Cancer Care applications, including radiation oncology quality assurance, delivering patient safety solutions for diagnostic imaging and radiation therapy centers around the world, radiation therapy quality assurance solutions for calibrating and verifying imaging and treatment accuracy, and radionuclide therapy products for nuclear medicine applications such as product handling and medical imaging furniture. Other Medical segment products include dosimetry solutions for monitoring the total amount of radiation medical staff members are exposed to over time,
The Nuclear & Safety segment provides radiation detection equipment for power plants, labs and research facilities and industrial and defense applications. Nuclear products are concentrated in power plant product offerings that are used for the full nuclear power plant lifecycle including core detectors and essential measurement devices for new build, maintenance,
107
decontamination and decommission equipment for monitoring and control during fuel dismantling, and remote environmental monitoring. Labs and research and other (primarily industrial and defense) are focused on the area of personal radiation detection for various safety and security requirements.
The CODM evaluates operating results and allocates capital resources between segments based on segment operating income (loss). Interest income and expense, loss (benefit) from income taxes, foreign currency loss (gain), net, other expense (income), net, and, if applicable, other items such as loss on debt extinguishment, are not allocated to segments.
The following tables summarize information about revenue, significant segment expenses, other segment items, and segment income (loss) from operations for each reportable segment (in millions). Reconciliation of consolidated segment income (loss) from operations to consolidated income (loss) before income taxes is shown in the Total column of each table.
Fiscal Year Ended December 31, 2025 | |||||||||||||||||
| Medical | Nuclear & Safety | Total | |||||||||||||||
| Revenues | $ | $ | $ | ||||||||||||||
| Less: | |||||||||||||||||
Adjusted cost of revenues1 | |||||||||||||||||
Other segment items2 | |||||||||||||||||
| Segment income from operations | $ | $ | $ | ||||||||||||||
Other loss3 | ( | ||||||||||||||||
| Income from operations | |||||||||||||||||
| Less other expense (income): | |||||||||||||||||
| Interest expense | |||||||||||||||||
| Interest income | ( | ||||||||||||||||
| Loss on debt extinguishment | |||||||||||||||||
| Foreign currency (gain)/loss, net | ( | ||||||||||||||||
| Other income, net | |||||||||||||||||
| Consolidated income before income taxes | $ | ||||||||||||||||
Fiscal Year Ended December 31, 2024 | |||||||||||||||||
| Medical | Nuclear & Safety | Total | |||||||||||||||
| Revenues | $ | $ | $ | ||||||||||||||
| Less: | |||||||||||||||||
Adjusted cost of revenues1 | |||||||||||||||||
Other segment items2 | |||||||||||||||||
| Segment income from operations | $ | $ | $ | ||||||||||||||
Other loss3 | ( | ||||||||||||||||
| Income from operations | |||||||||||||||||
| Less other expense (income): | |||||||||||||||||
| Interest expense | |||||||||||||||||
| Interest income | ( | ||||||||||||||||
| Foreign currency (gain)/loss, net | |||||||||||||||||
| Increase in fair value of warrant liabilities | |||||||||||||||||
| Other income, net | ( | ||||||||||||||||
| Consolidated loss before income taxes | $ | ( | |||||||||||||||
108
Fiscal Year Ended December 31, 2023 | |||||||||||||||||
| Medical | Nuclear & Safety | Total | |||||||||||||||
| Revenues | $ | $ | $ | ||||||||||||||
| Less: | |||||||||||||||||
Adjusted cost of revenues1 | |||||||||||||||||
Other segment items2 | |||||||||||||||||
| Segment income from operations | $ | $ | $ | ||||||||||||||
Other loss3 | ( | ||||||||||||||||
| Loss from operations | ( | ||||||||||||||||
| Less other expense (income): | |||||||||||||||||
| Interest expense | |||||||||||||||||
| Interest income | ( | ||||||||||||||||
| Loss on debt extinguishment | |||||||||||||||||
| Foreign currency (gain)/loss, net | ( | ||||||||||||||||
| Increase in fair value of warrant liabilities | |||||||||||||||||
| Other income, net | ( | ||||||||||||||||
| Consolidated loss before income taxes | $ | ( | |||||||||||||||
1 | Adjusted cost of revenues is a significant expense category, and amounts align with the segment-level information that is regularly provided to the CODM. Adjusted cost of revenues is defined by management as cost of revenues adjusted for purchase accounting impacts and excluding depreciation, amortization, and other segment expenses identified as non-operating by management. | ||||
2 | Other segment items included in segment income (loss) from operations for each segment include research and development expenses; selling and marketing expenses; general and administrative expenses; and any amounts excluded from cost of revenues to determine adjusted costs of revenues (e.g., depreciation, amortization, and other segment expenses identified as non-operating by management). | ||||
3 | Other loss consists of research and development expenses; selling and marketing expenses; and general and administrative expenses not allocated to the segments. | ||||
The Company’s assets by reportable segment were not included, as this information is not reviewed by, nor otherwise provided to, the CODM to make operating decisions or allocate resources.
The following table summarizes capital expenditures and depreciation and amortization for each reportable segment (in millions).
Fiscal Year Ended December 31, 2025 | Fiscal Year Ended December 31, 2024 | Fiscal Year Ended December 31, 2023 | |||||||||||||||
| Capital expenditures | |||||||||||||||||
| Medical | $ | $ | $ | ||||||||||||||
| Nuclear & Safety | |||||||||||||||||
| Total operating and reportable segments | |||||||||||||||||
| Corporate and other | |||||||||||||||||
| Total capital expenditures | $ | $ | $ | ||||||||||||||
| Depreciation and amortization | |||||||||||||||||
| Medical | $ | $ | $ | ||||||||||||||
| Nuclear & Safety | |||||||||||||||||
| Total operating and reportable segments | |||||||||||||||||
| Corporate and other | |||||||||||||||||
| Total depreciation and amortization | $ | $ | $ | ||||||||||||||
109
The following details revenues by geographic region. Revenues generated from external customers are attributed to geographic regions through sales from site locations (i.e. point of origin) (in millions).
| Revenues | |||||||||||||||||
Fiscal Year Ended December 31, 2025 | Fiscal Year Ended December 31, 2024 | Fiscal Year Ended December 31, 2023 | |||||||||||||||
| North America | |||||||||||||||||
| Medical | $ | $ | $ | ||||||||||||||
| Nuclear & Safety | |||||||||||||||||
| Total North America | |||||||||||||||||
| Europe | |||||||||||||||||
| Medical | |||||||||||||||||
| Nuclear & Safety | |||||||||||||||||
| Total Europe | |||||||||||||||||
| Asia Pacific | |||||||||||||||||
| Medical | |||||||||||||||||
| Nuclear & Safety | |||||||||||||||||
| Total Asia Pacific | |||||||||||||||||
| Total Revenues | $ | $ | $ | ||||||||||||||
Revenues generated in the United States were $525.9 million, $497.9 million, and $476.0 million for the fiscal years ended December 31, 2025, December 31, 2024 and December 31, 2023, respectively. Revenues in France were $193.7 million, $181.5 million, and $155.4 million for the fiscal years ended December 31, 2025, December 31, 2024 and December 31, 2023, respectively. No other country generated more than 10% of revenue individually.
The following details revenues by timing of recognition (in millions):
| Revenues | |||||||||||||||||
Fiscal Year Ended December 31, 2025 | Fiscal Year Ended December 31, 2024 | Fiscal Year Ended December 31, 2023 | |||||||||||||||
| Point in time | $ | $ | $ | ||||||||||||||
| Over time | |||||||||||||||||
| Total revenues | $ | $ | $ | ||||||||||||||
110
The following details revenues by product for each segment (in millions). The Company updated the categorization of its products to better align with the markets driving demand. The revenues by product information has been recast for all prior periods presented.
| Revenues | |||||||||||||||||
Fiscal Year Ended December 31, 2025 | Fiscal Year Ended December 31, 2024 | Fiscal Year Ended December 31, 2023 | |||||||||||||||
| Medical segment: | |||||||||||||||||
| Cancer care | $ | $ | $ | ||||||||||||||
| Other | |||||||||||||||||
| Nuclear & Safety segment: | |||||||||||||||||
| Nuclear | |||||||||||||||||
| Labs and research | |||||||||||||||||
| Other | |||||||||||||||||
| Total Revenues | $ | $ | $ | ||||||||||||||
The following details property, plant, and equipment, net, by geography (in millions):
| Property, Plant, and Equipment, Net | |||||||||||
December 31, 2025 | December 31, 2024 | ||||||||||
| North America | $ | $ | |||||||||
| Europe | |||||||||||
| Asia Pacific | |||||||||||
| Total | $ | $ | |||||||||
18. Fair Value Measurements
The Company applies fair value accounting to all financial assets and liabilities that are recognized or disclosed at fair value in the consolidated financial statements on a recurring basis. The fair value of the Company’s cash and cash equivalents, restricted cash, accounts receivable, and other current assets and liabilities approximates their carrying amounts due to the relatively short maturity of these items. The fair value of third-party debt approximates the carrying value because the interest rates are variable and reflect market rates.
Fair Value of Financial Instruments
The Company categorizes assets and liabilities recorded at fair value in the Consolidated Balance Sheets based upon the level of judgment associated with inputs used to measure their fair value. It is not practicable due to cost and effort for the Company to estimate the fair value of notes issued to related parties primarily due to the nature of their terms relative to the entity’s capital structure.
Assets and liabilities carried at fair value are valued and disclosed in one of the following three levels of the valuation hierarchy:
Level 1 – Inputs are unadjusted quoted prices in active markets for identical assets or liabilities.
Level 2 – Inputs are quoted prices in active markets for similar assets or liabilities or inputs that can be corroborated by observable market data for substantially the full term of the assets or liabilities.
Level 3 – Inputs are unobservable and require significant management judgment or estimation.
111
The following table summarizes the financial assets and liabilities of the Company that are measured at fair value on a recurring basis (in millions):
Fair Value Measurements at December 31, 2025 | |||||||||||||||||
| Level 1 | Level 2 | Level 3 | |||||||||||||||
| Assets | |||||||||||||||||
| Cash, cash equivalents, and restricted cash (Note 13) | $ | $ | $ | ||||||||||||||
| Discretionary retirement plan (Note 14) | $ | $ | $ | ||||||||||||||
| Accrued interest receivable on cross-currency rate swaps (Note 19) | $ | $ | $ | ||||||||||||||
| Liabilities | |||||||||||||||||
| Discretionary retirement plan (Note 14) | $ | $ | $ | ||||||||||||||
| Interest rate swap (Note 19) | $ | $ | $ | ||||||||||||||
| Cross-currency rate swaps (Note 19) | $ | $ | $ | ||||||||||||||
Fair Value Measurements at December 31, 2024 | |||||||||||||||||
| Level 1 | Level 2 | Level 3 | |||||||||||||||
| Assets | |||||||||||||||||
| Cash, cash equivalents, and restricted cash (Note 13) | $ | $ | $ | ||||||||||||||
| Discretionary retirement plan (Note 14) | $ | $ | $ | ||||||||||||||
| Accrued interest receivable on cross-currency rate swaps (Note 19) | $ | $ | $ | ||||||||||||||
| Interest rate swap (Note 19) | $ | $ | $ | ||||||||||||||
| Liabilities | |||||||||||||||||
| Discretionary retirement plan (Note 14) | $ | $ | $ | ||||||||||||||
| Cross-currency rate swaps (Note 19) | $ | $ | $ | ||||||||||||||
Cash equivalents include investments in money market funds which are reported at fair value. The fair value of money market funds was determined using quoted prices for identical investments in active markets, which are considered to be Level 1 inputs under the fair value measurements and disclosure guidance.
The cross-currency rate swaps and the interest rate swaps are not exchange traded instruments, and their fair value is determined using the cash flows of the swap contracts, discount rates to account for the passage of time, current foreign exchange market data, current interest rate (SOFR) data, and credit risk, which are all based on inputs readily available in public markets and categorized as Level 2 fair value hierarchy measurements.
19. Derivatives and Hedging
The Company's policy requires that derivatives are used solely for managing risks and not for speculative purposes. As a result of the Company’s European operations, the Company is exposed to fluctuations in exchange rates between EURO and USD. As such, the Company entered into cross-currency rate swaps during the year ended December 31, 2022, to manage currency risks related to our investments in foreign operations. During the year ended December 31, 2024, the Company extended a cross-currency rate swap derivative by one year (notional amount of 123.2 million euros). During the year ended December 31, 2025, the Company extended the same cross-currency rate swap derivative by two years (notional amount of 123.2 million euros). The Company is also subject to interest rate risk related to the Credit Facilities. The Company manages its risk to interest rate fluctuations through the use of derivative financial instruments. As such, the Company entered into an interest rate swap (notional amount of $75.0 million) during the year ended December 31, 2023, as well as an additional interest rate swap (notional amount of $100.0 million) during the year ended December 31, 2025, to mitigate the risk of adverse changes in benchmark interest rates on the Company's future interest payments (collectively, the "interest rate swaps").
112
All derivative instruments are carried at fair value in our consolidated balance sheets. The following table presents the fair values of the Company’s derivative instruments that were designated and qualified as part of a hedging relationship (in millions):
Fair Value (1) | ||||||||||||||||||||
| Derivatives Designated as Hedging Instruments | Balance Sheet Location | December 31, 2025 | December 31, 2024 | |||||||||||||||||
| Assets: | ||||||||||||||||||||
| Accrued interest receivable on cross-currency rate swaps | Prepaid expenses and other currents assets | $ | $ | |||||||||||||||||
| Interest rate swap | Other non-current assets | |||||||||||||||||||
| Total assets | $ | $ | ||||||||||||||||||
| Liabilities: | ||||||||||||||||||||
| Interest rate swaps | Derivative liabilities, current | $ | $ | |||||||||||||||||
| Cross-currency rate swap | Derivative liabilities, current | $ | ||||||||||||||||||
| Cross-currency rate swap | Other non-current liabilities | |||||||||||||||||||
| Total liabilities | $ | $ | ||||||||||||||||||
(1) Refer to Note 18, Fair Value Measurements, for additional information related to the estimated fair value. | ||||||||||||||||||||
Counterparty Credit Risk
Outstanding financial derivative instruments expose the Company to credit loss in the event of nonperformance by the counterparties to the derivative agreements. The Company's credit exposure related to these financial instruments is represented by the notional amount of the hedging instruments. The Company manages its exposure to counterparty credit risk through minimum credit standards, diversification of counterparties, and procedures to monitor concentrations of credit risk. The Company's derivative instruments are with financial institutions of investment grade or better. Counterparty credit risk will be monitored through periodic review of counterparty bank’s credit ratings and public financial filings. Based on these factors, the Company considers the risk of counterparty default to be minimal.
Cash Flow Hedging Strategy
The Company uses cash flow hedges to minimize the variability in cash flows of assets or liabilities or forecasted transactions caused by fluctuations in interest rates. The changes in the fair values of derivatives designated as cash flow hedges are recorded in accumulated other comprehensive loss (“AOCL”) and are reclassified into the line item in our Consolidated Statements of Operations in which the hedged items are recorded in the same period the hedged items affect earnings. The changes in the fair values of hedges that are determined to be ineffective are immediately reclassified from AOCL into earnings. The maximum length of time for which the Company hedges its exposure to the variability in future cash flows is three years .
During the year ended December 31, 2025, the interest rate swaps resulted in a loss of $0.4 million recognized in other comprehensive income ("OCI"). Gains of $0.7 million were recognized in income through interest expense and reclassified from OCI during the same periods. In addition, the Company did not have any ineffectiveness related to the cash flow hedges during the year ended December 31, 2025. The cash inflows and outflows associated with the Company’s derivative contracts designated as cash flow hedges are classified as financing activities in our Consolidated Statements of Cash Flows.
Hedges of Net Investments in Foreign Operations Strategy
The Company uses fixed-to-fixed cross-currency rate swaps ("CCRS") to protect the net investment on pre-tax basis in the Company’s EUR-denominated operations against changes in spot exchange rates. For derivative financial instruments that are designated and qualify as hedges of net investments in foreign operations, the changes in the fair values of the derivative financial instruments are recognized in net investment hedges adjustments, a component of accumulated other comprehensive loss ("AOCL"), to offset the changes in the values of the net investments being hedged. Any ineffective portions of net investment hedges are reclassified from AOCL into earnings during the period of change.
113
The following table summarizes the notional values and pretax impact of changes in the fair values of instruments designated as net investment hedges (in millions):
| Notional Amount | Gain (Loss) Recognized in AOCL | |||||||||||||||||||||||||||||||
| As of | Fiscal Year Ended December 31, 2025 | Fiscal Year Ended December 31, 2024 | Fiscal Year Ended December 31, 2023 | |||||||||||||||||||||||||||||
December 31, 2025 | December 31, 2024 | |||||||||||||||||||||||||||||||
| Cross-currency rate swaps | € | € | $ | ( | $ | $ | ( | |||||||||||||||||||||||||
| Total | € | € | $ | ( | $ | $ | ( | |||||||||||||||||||||||||
The Company amended one of the cross-currency rate swaps (notional amount of 123.2 million euros) in both 2024 and 2025 to extend the maturity to December 31, 2025, and then to December 31, 2027, respectively. The cross-currency rate swap was dedesignated from previous hedge accounting, and then redesignated as a net investment hedge, resulting in an immaterial off-market impact to the excluded interest component which has been and will be recognized systematically into earnings over the life of the derivative.
The Company did not reclassify any gains or losses related to net investment hedges from AOCL into earnings during the years ended December 31, 2025 and December 31, 2024. In addition, the Company did not have any ineffectiveness related to net investment hedges during the years ended December 31, 2025 and December 31, 2024. The cash inflows and outflows associated with the Company’s derivative contracts designated as net investment hedges are classified as investing or financing activities in our consolidated statements of cash flows.
20. Earnings (Loss) Per Share
A reconciliation of the numerator and denominator used in the calculation of basic and diluted earnings (loss) per common share is as follows (in millions, except share and per share amounts):
Fiscal Year Ended December 31, 2025 | Fiscal Year Ended December 31, 2024 | Fiscal Year Ended December 31, 2023 | ||||||||||||||||||
| Net earnings (loss) attributable to Mirion Technologies, Inc. shareholders | $ | $ | ( | $ | ( | |||||||||||||||
| Weighted average common shares outstanding – basic | ||||||||||||||||||||
| Effect of potentially dilutive securities – stock-based awards | ||||||||||||||||||||
| Effect of potentially dilutive securities – convertible debt | ||||||||||||||||||||
| Weight average common shares outstanding – diluted | ||||||||||||||||||||
| Net earnings (loss) per common share attributable to Mirion Technologies, Inc. — basic | $ | $ | ( | $ | ( | |||||||||||||||
| Net earnings (loss) per common share attributable to Mirion Technologies, Inc. — diluted | $ | $ | ( | $ | ( | |||||||||||||||
| Anti-dilutive employee stock-based awards, excluded | ||||||||||||||||||||
Net earnings (loss) per share of common stock is computed using the two-class method required for multiple classes of common stock and participating securities based upon their respective rights to receive dividends as if all income for the period has been distributed. Basic earnings (loss) per share is computed by dividing earnings (loss) available to common stockholders by the weighted average number of common shares outstanding, adjusted for the outstanding non-vested shares. Diluted earnings (loss) per share is computed by giving effect to all potentially dilutive securities outstanding for the period using the treasury stock method or the if-converted method based on the nature of such securities. For periods in
114
which the Company reports net losses, diluted net loss per common share attributable to common stockholders is the same as basic net loss per common share attributable to common stockholders, because potentially dilutive common shares are not assumed to have been issued if their effect is anti-dilutive. The Company incurred a net loss for the fiscal years ended December 31, 2024, and December 31, 2023; therefore, none of the potentially dilutive common shares were included in the diluted share calculations for those periods as they would have been anti-dilutive.
The following classes of common stock were considered in the earnings (loss) per share calculation.
Class A Common Stock
Holders of shares of our Class A common stock are entitled to one vote for each share held of record on all matters on which stockholders are entitled to vote generally, including the election or removal of directors. The holders of our Class A common stock do not have cumulative voting rights in the election of directors. Holders of shares of our Class A common stock are entitled to receive dividends when and if declared by the Company's Board of Directors out of funds legally available therefor, subject to any statutory or contractual restrictions on the payment of dividends and to any restrictions on the payment of dividends imposed by the terms of any outstanding preferred stock. Upon our liquidation, dissolution or winding up and after payment in full of all amounts required to be paid to creditors and to the holders of preferred stock having liquidation preferences, if any, the holders of shares of our Class A common stock will be entitled to receive pro rata our remaining assets available for distribution. Class A common stock issued and outstanding is included in the Company’s basic earnings (loss) per share calculation, with the exception of Founder Shares for certain periods as discussed below.
Class B Common Stock
Holders of shares of our Class B common stock are entitled to one vote for each share held of record on all matters on which stockholders are entitled to vote generally, including the election or removal of directors. If at any time the ratio at which shares of IntermediateCo Class B common stock are redeemable or exchangeable for shares of our Class A common stock changes from one -for-one as the number of votes to which our Class B common stockholders are entitled will be adjusted accordingly. The holders of our Class B common stock do not have cumulative voting rights in the election of directors. Except for transfers to us or to certain permitted transferees set forth in the IntermediateCo certificate of incorporation, paired interests may not be sold, transferred or otherwise disposed of.
Holders of shares of our Class B common stock are not entitled to economic interests in us or to receive dividends or to receive a distribution upon our liquidation or winding up. However, if IntermediateCo makes distributions to us other than solely with respect to our Class A common stock, the holders of paired interests will be entitled to receive distributions pro rata in accordance with the percentages of their respective shares of IntermediateCo Class B common stock.
Our Class B common stock has voting rights but no economic interest in the Company and therefore are excluded from the calculation of basic and diluted earnings (loss) per share.
Warrants
As described above, as of December 31, 2023, the Company had outstanding warrants to purchase up to 27,249,779 shares of Class A common stock (including 18,749,779 public warrants and 8,500,000 private placement warrants). One whole warrant entitles the holder thereof to purchase one share of Mirion Class A common stock at a price of $11.50 per share. For the year ended December 31, 2023 the Company’s outstanding warrants were not included in the Company’s calculation of basic loss per share and are excluded from the calculation of diluted loss per share because their inclusion would be anti-dilutive. During the second quarter of the year ended December 31, 2024, all warrants were exercised, redeemed, or exchanged for shares of Mirion Class A common stock or cash. Any shares of Mirion Class A common stock received are included in the calculation of basic and diluted earnings (loss) per share.
Founder Shares
The Founder Shares were subject to vesting in three equal tranches, based on the volume-weighted average price of our Class A common stock being greater than or equal to $12.00 , $14.00 and $16.00 per share for any 20 trading days in any 30 consecutive trading day period. Holders of the founder shares are entitled to vote such founder shares and receive dividends and other distributions with respect to such founder shares prior to vesting, but such dividends and other distributions with respect to unvested founder shares will be set aside by the Company and shall only be paid to the holders of the founder shares upon the vesting of such founder shares.
During the fourth quarter of the year ended December 31, 2024, all of the founder shares met the required vesting conditions and the Class A common shares were considered outstanding for purposes of our earnings (loss) per share calculation. Previous to the vesting, since the holders of the founder shares were not entitled to participate in earnings
115
unless the vesting conditions were met, the founders shares were previously excluded from the calculation of our earnings (loss) per share.
Stock-Based Awards
Each stock-based award represents the right to receive a Class A common stock upon vesting of the awards. Per ASC 260, Earnings Per Share ("EPS"), shares issuable for little or no cash consideration upon the satisfaction of certain conditions (i.e., contingently issuable shares) should be included in the computation of basic EPS as of the date that all necessary conditions have been satisfied. As such, any stock-based awards such as RSUs that vest will be included in the Company's basic earnings (loss) per share calculations as of the date when all necessary conditions are met. We determine the potential dilutive effect of outstanding stock-based awards on EPS using the treasury stock method.
Convertible Notes
During the year ended December 31, 2025, the Company issued $400.0 million aggregate principal amount of Convertible Notes due 2030 (the "2030 Notes") and an additional $375.0 million aggregate principal amount of Convertible Notes due 2031 (the "2031 Notes"). The initial conversion rate of the 2030 Notes and 2031 Notes is 43.2751 shares and 34.6951 shares, respectively, of Mirion's Class A common stock per $1,000 principal amount of Notes. We determine the potential dilutive impact of the outstanding Notes on EPS using the if-converted method, assuming the conversion of the Notes as of the earliest period reporting or at the date of issuance, if later. The effect of the related Capped Call transactions would be anti-dilutive and, as such, is excluded.
21. Restructuring and Related Impairments
The Company incurs costs associated with restructuring initiatives intended to improve operating performance, profitability, and working capital levels. Actions associated with these initiatives may include improving productivity, workforce reductions, and the consolidation of facilities.
As of December 31, 2025, the Company expects no additional charges from restructuring actions in the next 12 months.
The Company’s restructuring and impairment expenses are comprised of the following (in millions):
Fiscal Year Ended December 31, 2025 | |||||||||||||||||
| Cost of revenue | Selling, general and administrative | Total | |||||||||||||||
| Severance and employee costs | $ | $ | $ | ||||||||||||||
Fiscal Year Ended December 31, 2024 | |||||||||||||||||
| Cost of revenue | Selling, general and administrative | Total | |||||||||||||||
| Severance and employee costs | $ | $ | $ | ||||||||||||||
Asset impairments/Other(1) | |||||||||||||||||
| Total | $ | $ | $ | ||||||||||||||
Fiscal Year Ended December 31, 2023 | |||||||||||||||||
| Cost of revenue | Selling, general and administrative | Total | |||||||||||||||
| Severance and employee costs | $ | $ | $ | ||||||||||||||
Asset impairments/Other(1) | |||||||||||||||||
| Total | $ | $ | $ | ||||||||||||||
116
The following table summarizes restructuring and impairment expenses for each reportable segment (in millions):
Fiscal Year Ended December 31, 2025 | Fiscal Year Ended December 31, 2024 | Fiscal Year Ended December 31, 2023 | |||||||||||||||
| Restructuring expenses and related asset impairments: | |||||||||||||||||
| Medical | $ | $ | $ | ||||||||||||||
| Nuclear & Safety | |||||||||||||||||
| Corporate and other | |||||||||||||||||
| Total | $ | $ | $ | ||||||||||||||
The following table summarizes the changes in the Company’s accrued restructuring balance for severance and employee costs, which are included in Accrued expenses and other current liabilities in the accompanying Consolidated Balance Sheets (in millions):
Balance at December 31, 2023 | $ | ||||
| Restructuring charges (excluding impairments) | |||||
| Payments | ( | ||||
| Adjustments | |||||
Balance at December 31, 2024 | $ | ||||
| Restructuring charges | |||||
| Payments | ( | ||||
| Adjustments | |||||
Balance at December 31, 2025 | $ | ||||
22. Noncontrolling Interests
The holders of IntermediateCo Class B common stock have the right to require IntermediateCo to redeem all or a portion of their IntermediateCo Class B common stock for, at the Company’s election, (1) newly issued shares of the Company’s Class A common stock on a one -for-one basis or (2) a cash payment equal to the product of the number of shares of IntermediateCo Class B common stock subject to redemption and the arithmetic average of the closing stock prices for a share of the Company’s Class A common stock for each of (3) consecutive full trading days ending on and including the last full trading day immediately prior to the date of redemption (subject to customary adjustments, including for stock splits, stock dividends and reclassifications).
As of December 31, 2025, the Company recognized noncontrolling interests for the 5,869,555 shares, representing 2.3 % of the non-voting Class B shares of IntermediateCo, that are not attributable to the Company. As of December 31, 2024, the Company recognized noncontrolling interests for the 6,504,885 shares, representing the 2.8 % of the non-voting Class B shares of IntermediateCo, that are not attributable to the Company.
117
23. Accumulated Other Comprehensive Loss / Income
The components of accumulated other comprehensive loss, net of tax, consist of the following (in millions):
December 31, 2025 | December 31, 2024 | ||||||||||
| Cumulative foreign currency translation adjustment, net of tax | $ | ( | $ | ( | |||||||
| Unrealized gain on pension and postretirement benefit plans, net of tax | |||||||||||
| Unrealized loss on net investment hedges, net of tax | ( | ( | |||||||||
| Unrealized (loss) gain on cash flow hedges, net of tax | ( | ||||||||||
| Less: cumulative loss attributable to noncontrolling interests | ( | ( | |||||||||
| Accumulated other comprehensive loss | $ | ( | $ | ( | |||||||
24. Subsequent Events
The Company has performed an evaluation of subsequent events through the date of issuance of the financial statements, noting no other items which require adjustment or disclosure.
118
ITEM 9. CHANGES IN AND DISAGREEMENTS WITH ACCOUNTANTS ON ACCOUNTING AND FINANCIAL DISCLOSURES
Not applicable.
ITEM 9A. CONTROLS AND PROCEDURES
Evaluation of Disclosure Controls and Procedures
Our Chief Executive Officer and our Chief Financial Officer, with the participation of other members of the Company’s management, have evaluated the effectiveness of the Company’s “disclosure controls and procedures” (as such term is defined in Exchange Act Rules 13a-15(e) and 15d-15(e)) as of the end of the period covered by this report and based on this evaluation have concluded that our disclosure controls and procedures were effective.
Management’s Report on Internal Control Over Financial Reporting
Management of the Company is responsible for establishing and maintaining adequate internal control over financial reporting as such term is defined in Rules 13a-15(f) and 15d-15(f) under the Securities Exchange Act of 1934. Our internal control over financial reporting is designed to provide reasonable assurance regarding the reliability of financial reporting and the preparation of financial statements for external purposes in accordance with accounting principles generally accepted in the United States of America. Because of its inherent limitations, internal control over financial reporting may not prevent or detect misstatements. Management has assessed the effectiveness of the Company's internal control over financial reporting as of December 31, 2025, based on criteria established in the Internal Control-Integrated Framework in 2013 issued by the Committee of Sponsoring Organizations of the Treadway Commission (COSO). In performing the evaluation of the effectiveness of our internal control over financial reporting, because we acquired Paragon in a business acquisition on December 1, 2025 as described in Part II, Item 8, Note 2, Business Combinations, Acquisitions, and Business Disposals, to our consolidated financial statements, our management team has excluded the operations of Paragon in accordance with the SEC's general guidance that an assessment of a recently acquired business may be omitted from the scope of the evaluation for a period of up to one year following the acquisitions. Total assets (excluding goodwill and intangible assets acquired) and revenue subject to Paragon's internal control over financial reporting represent approximately 5.5% and 1.0% of our consolidated total assets (excluding goodwill and intangible assets) and revenue, respectively, as of and for the year ended December 31, 2025. Our management team has concluded that as of December 31, 2025, our internal controls over financial reporting are effective based on these criteria.
The effectiveness of our internal control over financial reporting as of December 31, 2025, has been audited by Deloitte & Touche LLP, an independent registered public accounting firm, as stated in their report which appears herein.
Changes in Internal Control Over Financial Reporting
There have been no changes in the Company’s internal control over financial reporting during the Company’s fourth fiscal quarter ended December 31, 2025, that have materially affected, or are reasonably likely to materially affect, the Company’s internal control over financial reporting.
119
REPORT OF INDEPENDENT REGISTERED PUBLIC ACCOUNTING FIRM
To the shareholders and the Board of Directors of Mirion Technologies, Inc.
Opinion on Internal Control over Financial Reporting
We have audited the internal control over financial reporting of Mirion Technologies, Inc. and subsidiaries (the "Company") as of December 31, 2025, based on criteria established in Internal Control — Integrated Framework (2013) issued by the Committee of Sponsoring Organizations of the Treadway Commission (COSO). In our opinion, the Company maintained, in all material respects, effective internal control over financial reporting as of December 31, 2025, based on criteria established in Internal Control — Integrated Framework (2013) issued by COSO.
We have also audited, in accordance with the standards of the Public Company Accounting Oversight Board (United States) (PCAOB), the consolidated financial statements as of and for the year ended December 31, 2025, of the Company and our report dated February 19, 2026, expressed an unqualified opinion on those financial statements.
As described in Management’s Report on Internal Control Over Financial Reporting, management’s assessment of, and conclusion on, the effectiveness of internal control over financial reporting did not include the internal controls of Paragon Energy Solutions, LLC acquired on December 1, 2025, which is included in the Company’s consolidated financial statements since the date of acquisition and represented 5.5% of total assets as of December 31, 2025 after excluding goodwill and intangible assets acquired, and 1.0% of total revenues for the year ended December 31, 2025. Accordingly, our audit did not include the internal control over financial reporting at Paragon Energy Solutions, LLC.
Basis for Opinion
The Company's management is responsible for maintaining effective internal control over financial reporting and for its assessment of the effectiveness of internal control over financial reporting, included in the accompanying Management's Report on Internal Control over Financial Reporting. Our responsibility is to express an opinion on the Company's internal control over financial reporting based on our audit. We are a public accounting firm registered with the PCAOB and are required to be independent with respect to the Company in accordance with the U.S. federal securities laws and the applicable rules and regulations of the Securities and Exchange Commission and the PCAOB.
We conducted our audit in accordance with the standards of the PCAOB. Those standards require that we plan and perform the audit to obtain reasonable assurance about whether effective internal control over financial reporting was maintained in all material respects. Our audit included obtaining an understanding of internal control over financial reporting, assessing the risk that a material weakness exists, testing and evaluating the design and operating effectiveness of internal control based on the assessed risk, and performing such other procedures as we considered necessary in the circumstances. We believe that our audit provides a reasonable basis for our opinion.
Definition and Limitations of Internal Control over Financial Reporting
A company's internal control over financial reporting is a process designed to provide reasonable assurance regarding the reliability of financial reporting and the preparation of financial statements for external purposes in accordance with generally accepted accounting principles. A company's internal control over financial reporting includes those policies and procedures that (1) pertain to the maintenance of records that, in reasonable detail, accurately and fairly reflect the transactions and dispositions of the assets of the company; (2) provide reasonable assurance that transactions are recorded as necessary to permit preparation of financial statements in accordance with generally accepted accounting principles, and that receipts and expenditures of the company are being made only in accordance with authorizations of management and directors of the company; and (3) provide reasonable assurance regarding prevention or timely detection of unauthorized acquisition, use, or disposition of the company's assets that could have a material effect on the financial statements.
Because of its inherent limitations, internal control over financial reporting may not prevent or detect misstatements. Also, projections of any evaluation of effectiveness to future periods are subject to the risk that controls may become inadequate because of changes in conditions, or that the degree of compliance with the policies or procedures may deteriorate.
/s/ DELOITTE & TOUCHE LLP
Atlanta, GA
February 19, 2026
120
ITEM 9B. OTHER INFORMATION
(a) None.
(b) During the three months ended December 31, 2025, no director or officer (as defined in Rule 16a-1(f) of the Exchange Act) of the Company adopted terminated
ITEM 9C.
DISCLOSURE REGARDING FOREIGN JURISDICTION THAT PREVENT INSPECTIONS
Not applicable.
121
PART III
ITEM 10. DIRECTORS, EXECUTIVE OFFICERS AND CORPORATE GOVERNANCE
We have adopted a Code of Ethics and Business Conduct that applies to all of our employees, officers, and directors, including our Chief Executive Officer, Chief Financial Officer, and other executive and senior financial officers. The full text of our Code of Ethics and Business Conduct is available on the investor relations page on our website, ir.mirion.com. We intend to publish any amendments to the Code of Ethics and Business Conduct, or any waivers of its requirements, on the website address and location specified above. Information on, or that can be accessed through, our website is not part of this Annual Report.
We have adopted Insider Trading policies and procedures governing the purchase, sale and/or other dispositions of the Company's securities, including with respect to Rule 10b5-1 plans, that apply to our directors, officers and certain covered employees that are reasonably designed to promote compliance with insider trading laws, rules and regulations and any applicable listing standards.
The information otherwise required by this Item will be included in our definitive proxy statement for our 2026 annual meeting of stockholders, which will be filed with the SEC within 120 days after the end of our fiscal year ended December 31, 2025, and is incorporated herein by reference.
ITEM 11. EXECUTIVE COMPENSATION
The information required by this Item will be included in our definitive proxy statement for our 2026 annual meeting of stockholders, which will be filed with the SEC within 120 days after the end of our fiscal year ended December 31, 2025, and is incorporated herein by reference.
ITEM 12. SECURITY OWNERSHIP OF CERTAIN BENEFICIAL OWNER AND MANAGEMENT AND RELATED STOCKHOLDER MATTERS
The information required by this Item will be included in our definitive proxy statement for our 2026 annual meeting of stockholders, which will be filed with the SEC within 120 days after the end of our fiscal year ended December 31, 2025, and is incorporated herein by reference.
ITEM 13. CERTAIN RELATIONSHIPS AND RELATED TRANSACTIONS, AND DIRECTOR INDEPENDENCE
The information required by this Item will be included in our definitive proxy statement for our 2026 annual meeting of stockholders, which will be filed with the SEC within 120 days after the end of our fiscal year ended December 31, 2025, and is incorporated herein by reference.
ITEM 14. PRINCIPAL ACCOUNTING FEES AND SERVICES
The information required by this Item will be included in our definitive proxy statement for our 2026 annual meeting of stockholders, which will be filed with the SEC within 120 days after the end of our fiscal year ended December 31, 2025, and is incorporated herein by reference.
122
PART IV
ITEM 15. EXHIBITS AND FINANCIAL STATEMENT SCHEDULES
1. Financial Statements
See Index to consolidated financial statements appearing in Item 8 “Financial Statements and Supplementary Data” of this Annual Report.
2. Financial Statement Schedules
The following financial statement schedules are included in this Form 10-K:
•Schedule I - Condensed Financial Information of Registrant is presented for the fiscal years ended December 31, 2025, December 31, 2024, and December 31, 2023.
•Schedule II - Valuation and Qualifying Accounts is presented for the fiscal years ended December 31, 2025, December 31, 2024, and December 31, 2023.
All remaining schedules are omitted and are either inapplicable or not required, or the required information is presented in the financial statements or notes thereto.
3. Exhibits
The exhibits listed on the accompanying Exhibit Index are filed or incorporated by reference as part of this Annual Report.
123
EXHIBIT INDEX
124
125
Exhibit Number | Exhibit Title | |||||||
126
Exhibit Number | Exhibit Title | |||||||
| 101.INS* | XBRL Instance Document. | |||||||
| 101.SCH* | XBRL Taxonomy Extension Schema Document. | |||||||
| 101.CAL* | XBRL Taxonomy Extension Calculation Linkbase Document. | |||||||
| 101.DEF* | XBRL Taxonomy Extension Definition Linkbase Document. | |||||||
| 101.LAB* | XBRL Taxonomy Extension Label Linkbase Document. | |||||||
| 101.PRE* | XBRL Taxonomy Extension Presentation Linkbase Document. | |||||||
| 104 | Cover Page Interactive Data File (formatted as Inline XBRL and contained in Exhibit 101). | |||||||
* Filed herewith.
+ Indicates a management contract or compensatory plan
# This certification is deemed not filed for purposes of Section 18 of the Exchange Act, or otherwise subject to the liability of that section, nor shall it be deemed incorporated by reference into any filing under the Securities Act.
ITEM 16. FORM 10-K SUMMARY
None.
Schedule I - Condensed Financial Information of the Registrant
Mirion Technologies, Inc. has no material assets or standalone operations other than its ownership in its consolidated subsidiaries. There are restrictions under credit agreements governing the 2021 Credit Agreement, described in Note 8, Borrowings, on the Company’s ability to obtain funds from any of its subsidiaries through dividends. Accordingly, the following condensed financial information is presented on a “Parent-only” basis in which Mirion Technologies, Inc.’s investments in its consolidated subsidiaries are presented under the equity method of accounting.
127
MIRION TECHNOLOGIES, INC.
(PARENT COMPANY ONLY)
CONDENSED BALANCE SHEETS
(in millions)
| December 31, 2025 | December 31, 2024 | ||||||||||
| Assets: | |||||||||||
| Cash and cash equivalents | $ | $ | |||||||||
| Prepaid expenses and other current assets | |||||||||||
| Investments in subsidiaries | |||||||||||
| Total Assets | $ | $ | |||||||||
| Liabilities and Stockholders’ Equity: | |||||||||||
| Accrued expenses and other current liabilities | $ | $ | |||||||||
| Convertible debt | |||||||||||
| Deferred income taxes and other liabilities | ( | ( | |||||||||
| Total Liabilities | ( | ||||||||||
| Treasury stock | ( | ( | |||||||||
| Additional paid-in capital | |||||||||||
| Accumulated deficit | ( | ( | |||||||||
| Accumulated other comprehensive loss | ( | ( | |||||||||
| Mirion Technologies, Inc. stockholders’ equity | |||||||||||
| Noncontrolling interests | |||||||||||
| Total Stockholders’ Equity | |||||||||||
| Total Liabilities and Stockholders’ Equity | $ | $ | |||||||||
128
MIRION TECHNOLOGIES, INC.
(PARENT COMPANY ONLY)
CONDENSED STATEMENTS OF OPERATIONS AND COMPREHENSIVE INCOME (LOSS)
(in millions, except per share data)
Fiscal Year Ended December 31, 2025 | Fiscal Year Ended December 31, 2024 | Fiscal Year Ended December 31, 2023 | |||||||||||||||
| Operating expenses: | |||||||||||||||||
| Selling, general and administrative | $ | $ | $ | ||||||||||||||
| Total operating expenses | |||||||||||||||||
| Loss from operations | ( | ( | ( | ||||||||||||||
| Other expense (income): | |||||||||||||||||
| Increase in fair value of warrant liabilities | |||||||||||||||||
| Equity in net (income) loss of subsidiaries | ( | ||||||||||||||||
| Interest expense, net | |||||||||||||||||
| Other (income) expense, net | ( | ||||||||||||||||
| Income (loss) before income taxes | ( | ( | |||||||||||||||
| Income tax (benefit) expense | ( | ||||||||||||||||
| Net income (loss) | ( | ( | |||||||||||||||
| Income (loss) attributable to noncontrolling interests | ( | ( | |||||||||||||||
| Net income (loss) attributable to Mirion Technologies, Inc. stockholders | ( | ( | |||||||||||||||
| Other comprehensive (loss) income, net of tax: | |||||||||||||||||
| Foreign currency translation (loss) gain, net of tax | ( | ||||||||||||||||
| Other comprehensive income (loss), net of tax | ( | ||||||||||||||||
| Comprehensive income (loss) attributable to Mirion Technologies, Inc. stockholders | $ | $ | ( | $ | ( | ||||||||||||
| Earnings (loss) per common share attributable to Mirion Technologies, Inc.: | |||||||||||||||||
| Basic | $ | $ | ( | $ | ( | ||||||||||||
| Diluted | $ | $ | ( | $ | ( | ||||||||||||
| Weighted average common shares outstanding: | |||||||||||||||||
| Basic | |||||||||||||||||
| Diluted | |||||||||||||||||
129
MIRION TECHNOLOGIES, INC.
(PARENT COMPANY ONLY)
CONDENSED STATEMENTS OF CASH FLOWS
(in millions)
| Fiscal Year Ended December 31, 2025 | Fiscal Year Ended December 31, 2024 | Fiscal Year Ended December 31, 2023 | |||||||||||||||
| OPERATING ACTIVITIES: | |||||||||||||||||
| Net income (loss) | $ | $ | ( | $ | ( | ||||||||||||
| Adjustments to reconcile net income (loss) to net cash provided by operating activities: | |||||||||||||||||
| Stock-based compensation expense | |||||||||||||||||
| Amortization of debt issuance costs | |||||||||||||||||
| Change in deferred income taxes | ( | ||||||||||||||||
| Increase in fair value of warrant liabilities | |||||||||||||||||
| Changes in operating assets and liabilities: | |||||||||||||||||
| Prepaid expenses and other current assets | ( | ( | |||||||||||||||
| Accrued expenses and other current liabilities | |||||||||||||||||
| Other liabilities | ( | ||||||||||||||||
| Net cash provided by operating activities | |||||||||||||||||
| INVESTING ACTIVITIES: | |||||||||||||||||
| Investments in subsidiaries | ( | ||||||||||||||||
| Net cash used in investing activities | ( | ||||||||||||||||
| FINANCING ACTIVITIES: | |||||||||||||||||
| Issuances of common stock | |||||||||||||||||
| Common stock issuance costs | ( | ||||||||||||||||
| Purchases of stock for treasury | ( | ||||||||||||||||
| Proceeds from issuance of convertible senior notes, net of bank costs | |||||||||||||||||
| Third-party issuance costs for convertible senior notes | ( | ||||||||||||||||
| Purchase of capped calls related to convertible senior notes | ( | ||||||||||||||||
| Net cash provided by financing activities | |||||||||||||||||
| Net increase in cash, cash equivalents, and restricted cash | |||||||||||||||||
| Cash, cash equivalents, and restricted cash at beginning of period | |||||||||||||||||
| Cash, cash equivalents, and restricted cash at end of period | $ | $ | $ | ||||||||||||||
130
Note to Condensed Financial Statements of Registrant (Parent Company Only)
Basis of Presentation
These condensed parent company-only financial statements have been prepared in accordance with Rule 12-04, Schedule I of Regulation S-X, as the restricted net assets of the subsidiaries of Mirion (as defined in Rule 4-08(e)(3) of Regulation S-X) exceed the specified threshold amount of the consolidated net assets of the Company. Because we have a consolidated accumulated deficit, the 25% threshold described in Rule 4-08 does not apply and any restrictions of net assets at our subsidiaries trigger the requirement to present parent company-only financial information. The ability of Mirion’s operating subsidiaries to pay dividends may be restricted due to the terms of the subsidiaries’ outstanding term loan and revolving credit facility borrowings as described in Note 8, Borrowings, to the audited consolidated financial statements.
These condensed parent company-only financial statements have been prepared using the same accounting principles and policies described in the notes to the consolidated financial statements, with the only exception being that the parent company accounts for its subsidiaries using the equity method. These condensed parent company-only financial statements should be read in conjunction with the consolidated financial statements and related notes.
131
Schedule II
| Valuation and Qualifying Accounts | ||||||||||||||||||||||||||||||||
| (Dollars in millions) | ||||||||||||||||||||||||||||||||
| Balance at | Charged to | Balance at | ||||||||||||||||||||||||||||||
| Beginning | Costs and | Deductions | End of | |||||||||||||||||||||||||||||
| Description | of Period | Expenses | (a) | Other (b) | Period | |||||||||||||||||||||||||||
Year Ended December 31, 2025 | ||||||||||||||||||||||||||||||||
| Allowance for doubtful accounts | ( | |||||||||||||||||||||||||||||||
| Product warranty | ( | |||||||||||||||||||||||||||||||
Year Ended December 31, 2024 | ||||||||||||||||||||||||||||||||
| Allowance for doubtful accounts | ( | |||||||||||||||||||||||||||||||
| Product warranty | ( | |||||||||||||||||||||||||||||||
Year Ended December 31, 2023 | ||||||||||||||||||||||||||||||||
| Allowance for doubtful accounts | ( | |||||||||||||||||||||||||||||||
| Product warranty | ( | |||||||||||||||||||||||||||||||
(a)Charges to the accounts included in this column are for the purposes for which the reserves were created and valuation adjustments
(b)Amounts included in this column relate to foreign currency translation and other adjustments
132
SIGNATURES AND POWER OF ATTORNEY
Pursuant to the requirements of the Securities Exchange Act of 1934, the registrant has duly caused this report to be signed on its behalf by the undersigned, thereunto duly authorized.
Date: February 19, 2026
| MIRION TECHNOLOGIES, INC. | ||||||||
| By | /s/ Thomas D. Logan | |||||||
| Name: Thomas D. Logan | ||||||||
| Title: Chief Executive Officer and Director | ||||||||
KNOW ALL PERSONS BY THESE PRESENTS, that each person whose signature appears below constitutes and appoints Thomas D. Logan, Brian Schopfer and Emmanuelle Lee and each of them, his or her true and lawful attorneys-in-fact and agents, with full power of substitution and resubstitution, for him or her and in his or her name, place and stead, in any and all capacities, to sign any and all amendments to this Annual Report on Form 10-K, and to file the same, with all exhibits thereto, and all other documents in connection therewith, with the Securities and Exchange Commission, granting unto each said attorney-in-fact and agents full power and authority to do and perform each and every act in person, hereby ratifying and confirming all that said attorneys-in-fact and agents or either of them or their or his or her substitute or substitutes may lawfully do or cause to be done by virtue hereof.
Pursuant to the requirements of the Securities Exchange Act of 1934, this report has been signed by the following persons on behalf of the registrant and in the capacities and on the dates indicated.
| Name | Title | Date | ||||||
/s/ Thomas D. Logan Thomas D. Logan | Chief Executive Officer, Director and Chairman (principal executive officer) | February 19, 2026 | ||||||
/s/ Brian Schopfer Brian Schopfer | Chief Financial Officer (principal financial officer) | February 19, 2026 | ||||||
| /s/ Christopher Moore Christopher Moore | Chief Accounting Officer (principal accounting officer) | February 19, 2026 | ||||||
/s/ Lawrence D. Kingsley Lawrence D. Kingsley | Director | February 19, 2026 | ||||||
/s/ Sheila Rege Sheila Rege | Director | February 19, 2026 | ||||||
/s/ Steven W. Etzel Steven W. Etzel | Director | February 19, 2026 | ||||||
/s/ Kenneth C. Bockhorst Kenneth C. Bockhorst | Director | February 19, 2026 | ||||||
133
| Name | Title | Date | ||||||
/s/ Robert A. Cascella Robert A. Cascella | Director | February 19, 2026 | ||||||
/s/ John W. Kuo John W. Kuo | Director | February 19, 2026 | ||||||
/s/ Jody A. Markopoulos Jody A. Markopoulos | Director | February 19, 2026 | ||||||
134